Fig. G.3.
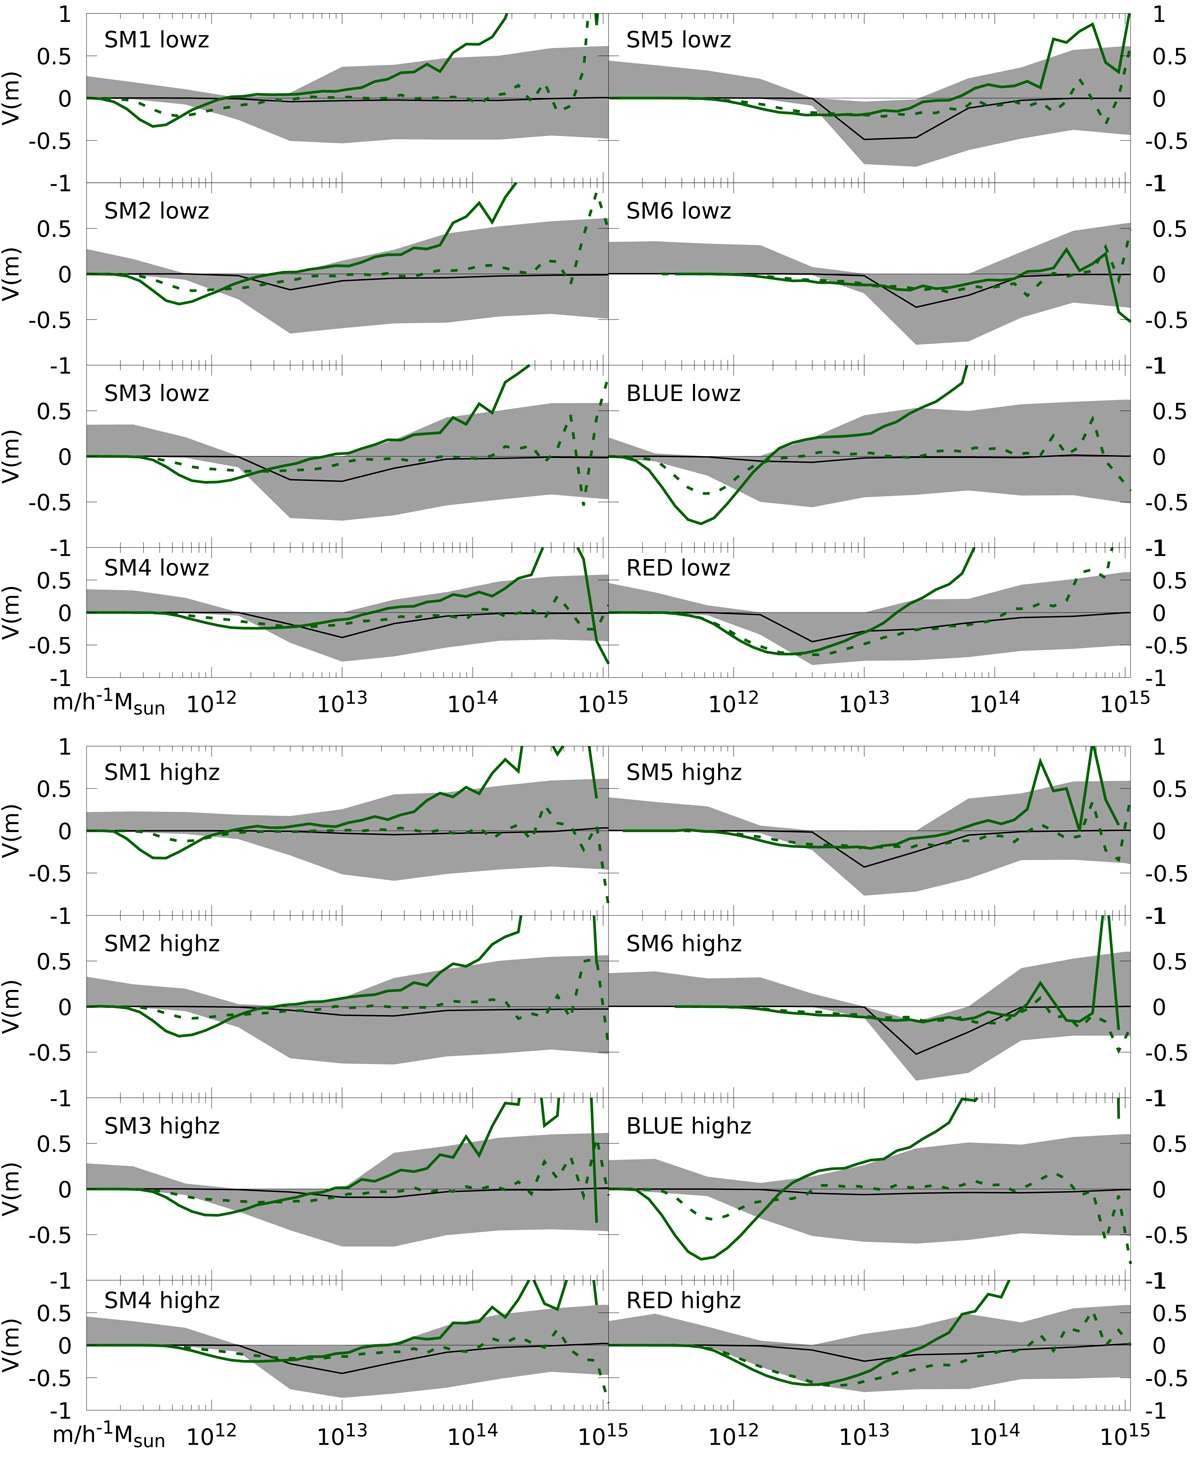
Posterior density of the normalised excess variance V(m) = [⟨N(N − 1)|m⟩−⟨N|m⟩2] ⟨N|m⟩−1 (y-axis) as a function of halo mass m/h−1 M⊙ (x-axis) for the low-z galaxy samples (top) and high-z samples (bottom). The shaded regions are the 68% CIs around the median (black solid lines). The green lines show V(m) for H15 (solid) and L12 (dashed) directly from the ⟨N(N − 1)|m⟩ in the simulation snapshots.
Current usage metrics show cumulative count of Article Views (full-text article views including HTML views, PDF and ePub downloads, according to the available data) and Abstracts Views on Vision4Press platform.
Data correspond to usage on the plateform after 2015. The current usage metrics is available 48-96 hours after online publication and is updated daily on week days.
Initial download of the metrics may take a while.