Fig. 4.
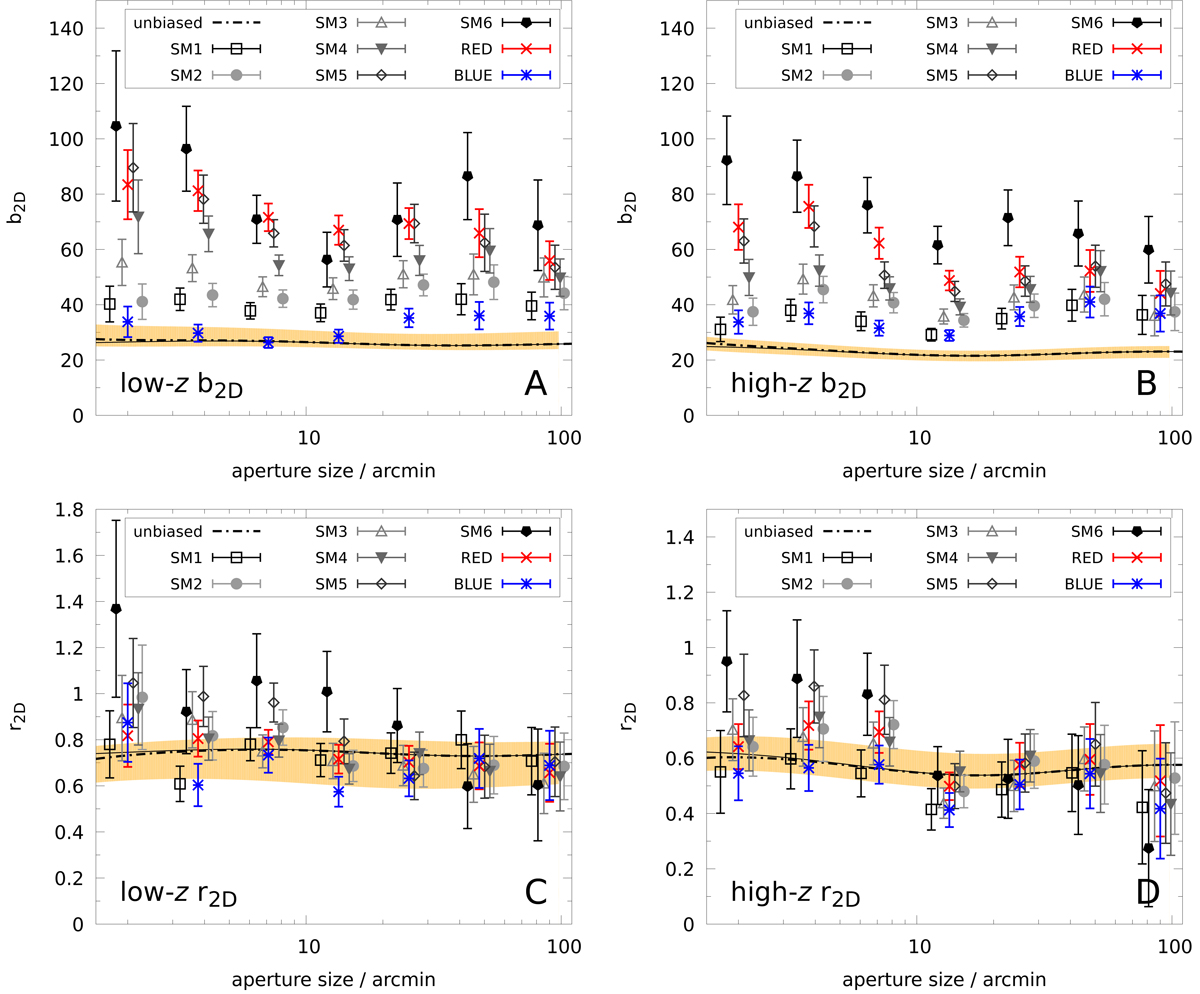
Observed ratio statistics with jackknife errors for the CFHTLenS lens samples in the low-z bin (panels A and C) and the high-z bin (panels B and D). The source samples are BACK low-z and BACK high-z, respectively. The data points are slightly shifted along the x-axis for better visibility. The dashed lines are predictions for unbiased galaxies (the galaxy-bias normalisation) with SM3 pd(z). The shaded regions bracket the prediction variations using the pd(z) of the other lens samples. Top panels: relative clustering ![]() of galaxies and matter. Bottom panels: correlation
of galaxies and matter. Bottom panels: correlation ![]() between the (projected) galaxy and matter distribution. This plot uses seven evenly spaced aperture sizes instead of the eight used in the analysis.
between the (projected) galaxy and matter distribution. This plot uses seven evenly spaced aperture sizes instead of the eight used in the analysis.
Current usage metrics show cumulative count of Article Views (full-text article views including HTML views, PDF and ePub downloads, according to the available data) and Abstracts Views on Vision4Press platform.
Data correspond to usage on the plateform after 2015. The current usage metrics is available 48-96 hours after online publication and is updated daily on week days.
Initial download of the metrics may take a while.