Fig. 5.
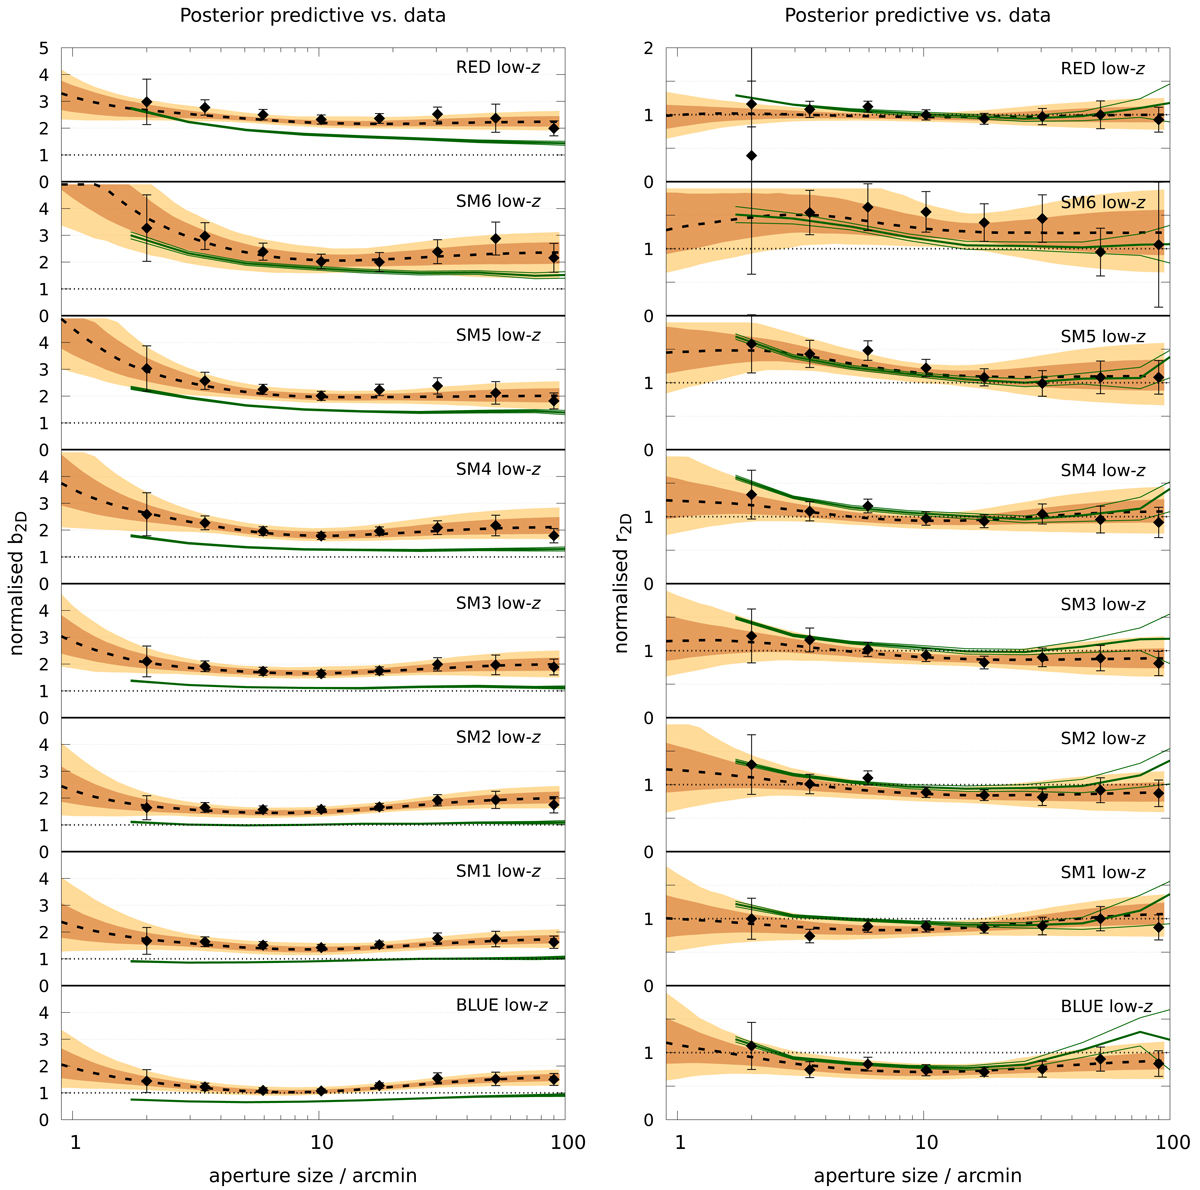
Posterior predictive checks for the low-z CFHTLenS samples. The data points are normalised bias measurements b2D (left panel) and r2D (right panel) with jackknife errors as a function of aperture size. The orange regions are the posterior predictive distributions of our templates with 68% and 95% CIs; the dashed lines are the median. The green solid lines depict the normalised bias and 68% confidence intervals for H15 mock data in SH18 without shape noise.
Current usage metrics show cumulative count of Article Views (full-text article views including HTML views, PDF and ePub downloads, according to the available data) and Abstracts Views on Vision4Press platform.
Data correspond to usage on the plateform after 2015. The current usage metrics is available 48-96 hours after online publication and is updated daily on week days.
Initial download of the metrics may take a while.