Fig. 7.
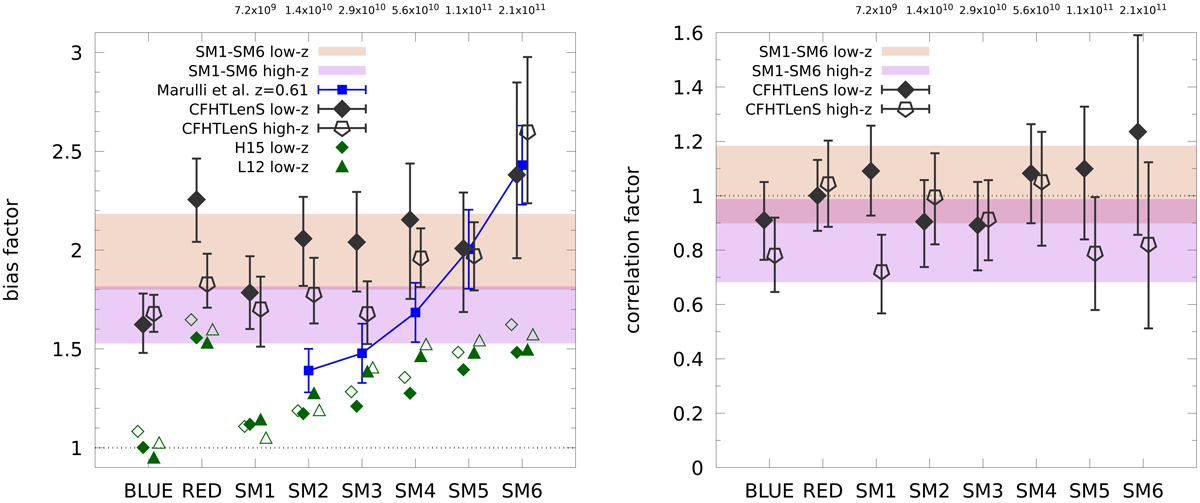
Large-scale bias bls (left panel) and correlation rls (right panel) for the galaxy populations indicated on the x-axis. The black data points are CFHTLenS results (medians and 68% CIs), the green data points in the left panel are SAM predictions (diamonds for H15, triangles for L12, filled symbols for low-z, and open symbols for high-z). The shaded areas are 68% CIs for CFHTLenS, merging SM1 to SM6 in an extra analysis. The blue squares are VIPERS bls for stellar-mass binned galaxies with iAB < 22.5 and median ![]() by Marulli et al. (2013).
by Marulli et al. (2013).
Current usage metrics show cumulative count of Article Views (full-text article views including HTML views, PDF and ePub downloads, according to the available data) and Abstracts Views on Vision4Press platform.
Data correspond to usage on the plateform after 2015. The current usage metrics is available 48-96 hours after online publication and is updated daily on week days.
Initial download of the metrics may take a while.