Fig. 9.
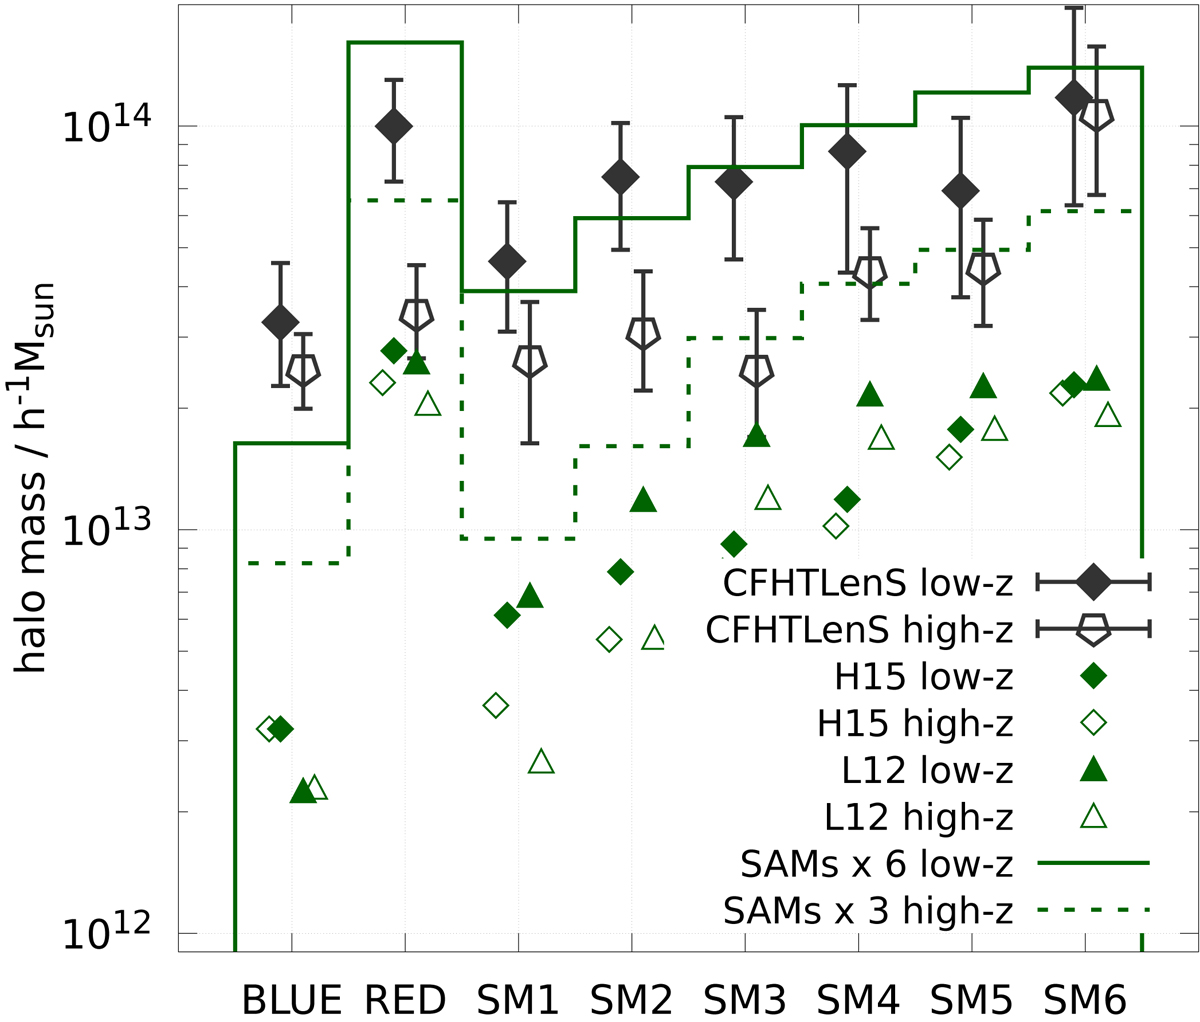
Characteristic halo mass m* that corresponds to the large-scale bias bls in Fig. 7 for the halo bias model by Tinker et al. (2005) and the Millennium Simulation cosmology as reference (Sect. 3.1). Data points with error bars indicate the CFHTLenS galaxy samples (x-axis) and the green points are the SAM predictions. The green lines average the SAM values and rescale them by a factor of 6 (solid line for low-z) or 3 (dashed line for high-z).
Current usage metrics show cumulative count of Article Views (full-text article views including HTML views, PDF and ePub downloads, according to the available data) and Abstracts Views on Vision4Press platform.
Data correspond to usage on the plateform after 2015. The current usage metrics is available 48-96 hours after online publication and is updated daily on week days.
Initial download of the metrics may take a while.