Fig. 10
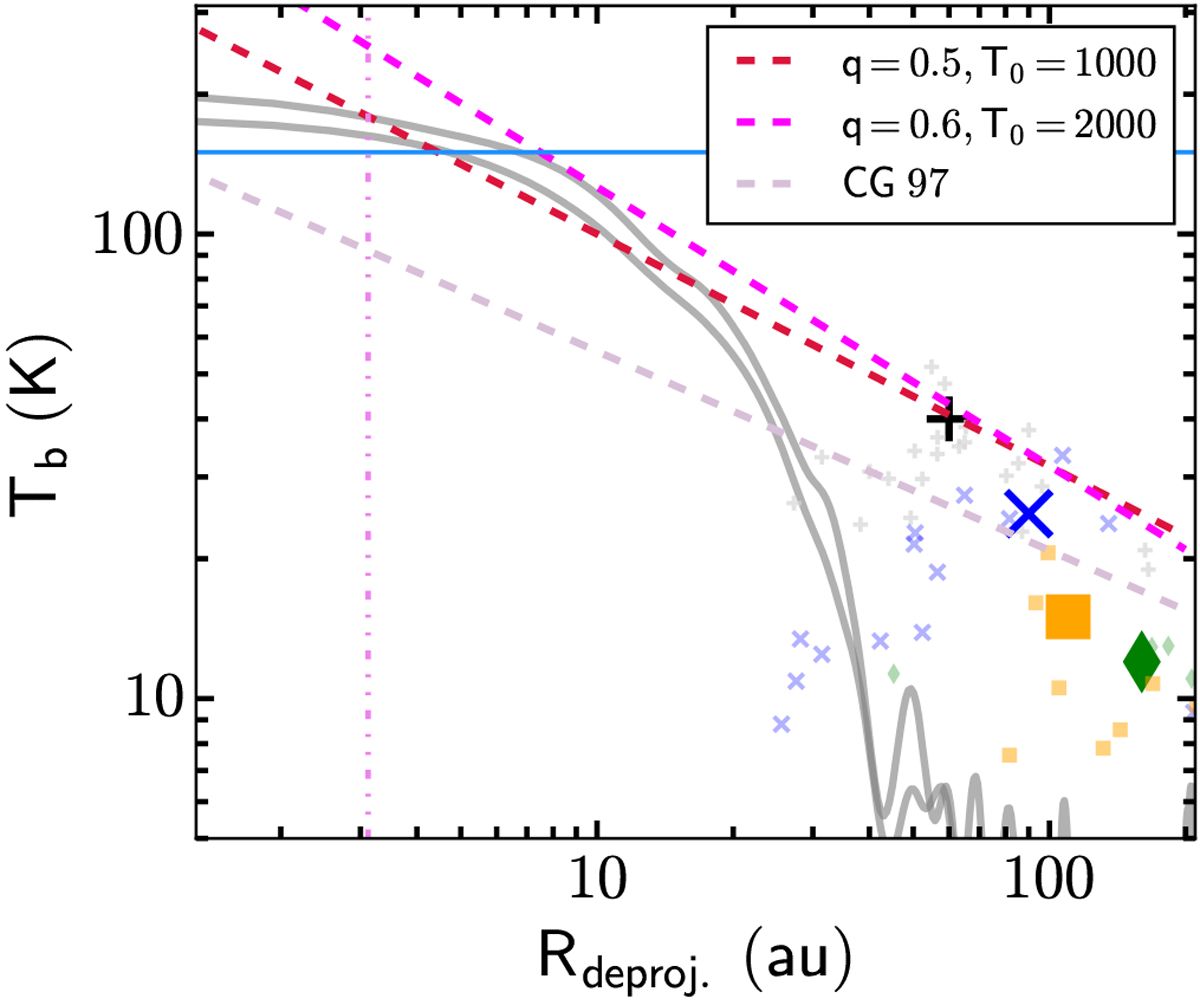
Brightness temperature profile along the disk major axis as a function of deprojected radius. Gray solid lines show the observed dust continuum brightness profile at 230 and 240 GHz. Peak brightness temperatures of 13CO (black +), HCO+ (blue crosses), HCN (green diamonds), and SO (orange squares) are also plotted. The smaller symbols show the observed peak temperatures at velocities between 1 and 4 km s−1 and 9–12 km s−1 that contain >3σ emission, while the large symbols indicate the averaged values of these points. For comparison, a power-law (![]() ) and the Chiang & Goldreich(1997; CG97) temperature profiles are also shown (dashed lines). The values of
T0 and q
are indicated in the legend. The vertical purple dashed-dot line indicates 0.5× the beam size, while the horizontal blue line denotes the water snowline at 160 K (Meijerink et al. 2009).
) and the Chiang & Goldreich(1997; CG97) temperature profiles are also shown (dashed lines). The values of
T0 and q
are indicated in the legend. The vertical purple dashed-dot line indicates 0.5× the beam size, while the horizontal blue line denotes the water snowline at 160 K (Meijerink et al. 2009).
Current usage metrics show cumulative count of Article Views (full-text article views including HTML views, PDF and ePub downloads, according to the available data) and Abstracts Views on Vision4Press platform.
Data correspond to usage on the plateform after 2015. The current usage metrics is available 48-96 hours after online publication and is updated daily on week days.
Initial download of the metrics may take a while.