Fig. 12
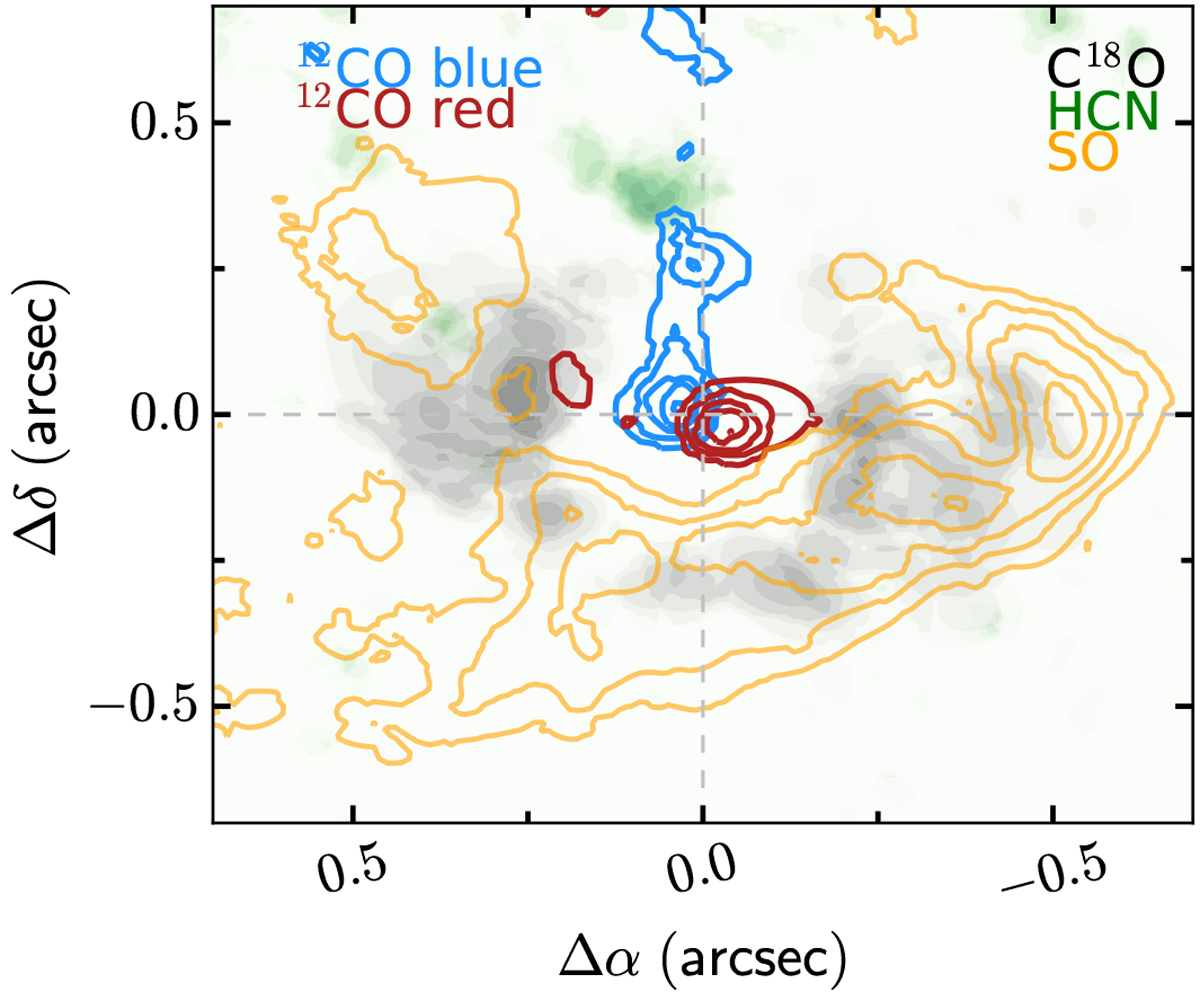
Comparison of SO, C18O, HCN, and 12CO emitting regions using zeroth moment maps. The C18O emission is shown in grayscale with a linear scaling between 0.2 and 0.8 of the maximum in order to highlight the disk component. Green filled contours shows HCN integrated from −1 to 6 km s−1. The color spans linearly from 0.3 to 1.0 of the maximum value. Blue-shifted 12CO (−7 to −1 km s−1) and red-shifted (13–19 km s−1) emission are highlighted by the blue and red contours, respectively. The contours span linearly from 0.15 to 1.0 of the maximum. Finally, the SO integrated emission is shown using orange contours with a linear scaling from 0.15 to 1.0 of the maximum.
Current usage metrics show cumulative count of Article Views (full-text article views including HTML views, PDF and ePub downloads, according to the available data) and Abstracts Views on Vision4Press platform.
Data correspond to usage on the plateform after 2015. The current usage metrics is available 48-96 hours after online publication and is updated daily on week days.
Initial download of the metrics may take a while.