Fig. 13
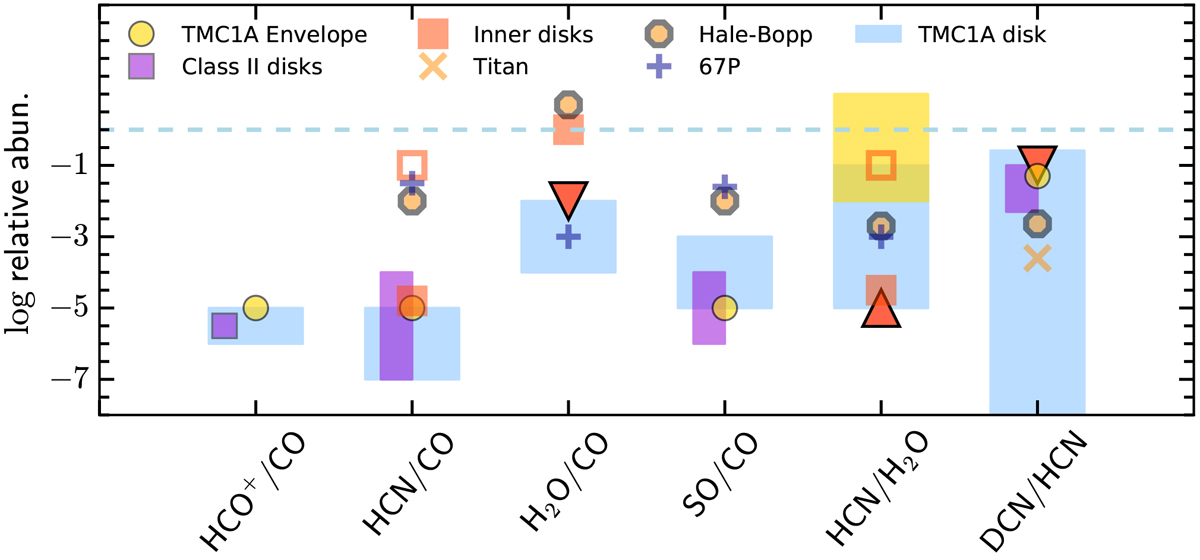
Comparison of the relative molecular gas abundances in the TMC1A disk and its envelope, Class II disks, and Solar System bodies. The range of values obtained in this work is shown by the blue shaded rectangles. The red arrows indicate lower and upper limits. Yellow circles indicate the molecular abundance ratios of the protostellar envelope around TMC1A from Jørgensen et al. (2004). The abundances of HCN and DCN in the envelope are approximated to the values in Schöier et al. (2002), Roberts et al. (2002), and Tafalla et al. (2006). The water gas fraction in the protostellar envelope is assumed to be between 10−7 and 10−4 based on models by Caselli et al. (2012) and Schmalzl et al. (2014). Molecular abundances in Class II disks (purple rectangles) are based on values from Mathews et al. (2013), Teague et al. (2015), Guzmán et al. (2015), Cleeves et al. (2018), Huang et al. (2017), and Booth et al. (2019). The inner disk hot gas molecular abundances (empty red squares) areadopted from Najita et al. (2013) and Salyk et al. (2011) shown by filled red squares. The abundances of comet Hale-Bopp are based on Bockelée-Morvan et al. (2000). The abundances of comet 67P/Churyumov–Gerasimenko are adopted from Rubin et al. (2019). The DCN/HCN fraction for Titan and comet Hale-Bopp are obtained from Molter et al. (2016) and Meier et al. (1998), respectively.
Current usage metrics show cumulative count of Article Views (full-text article views including HTML views, PDF and ePub downloads, according to the available data) and Abstracts Views on Vision4Press platform.
Data correspond to usage on the plateform after 2015. The current usage metrics is available 48-96 hours after online publication and is updated daily on week days.
Initial download of the metrics may take a while.