Fig. B.1
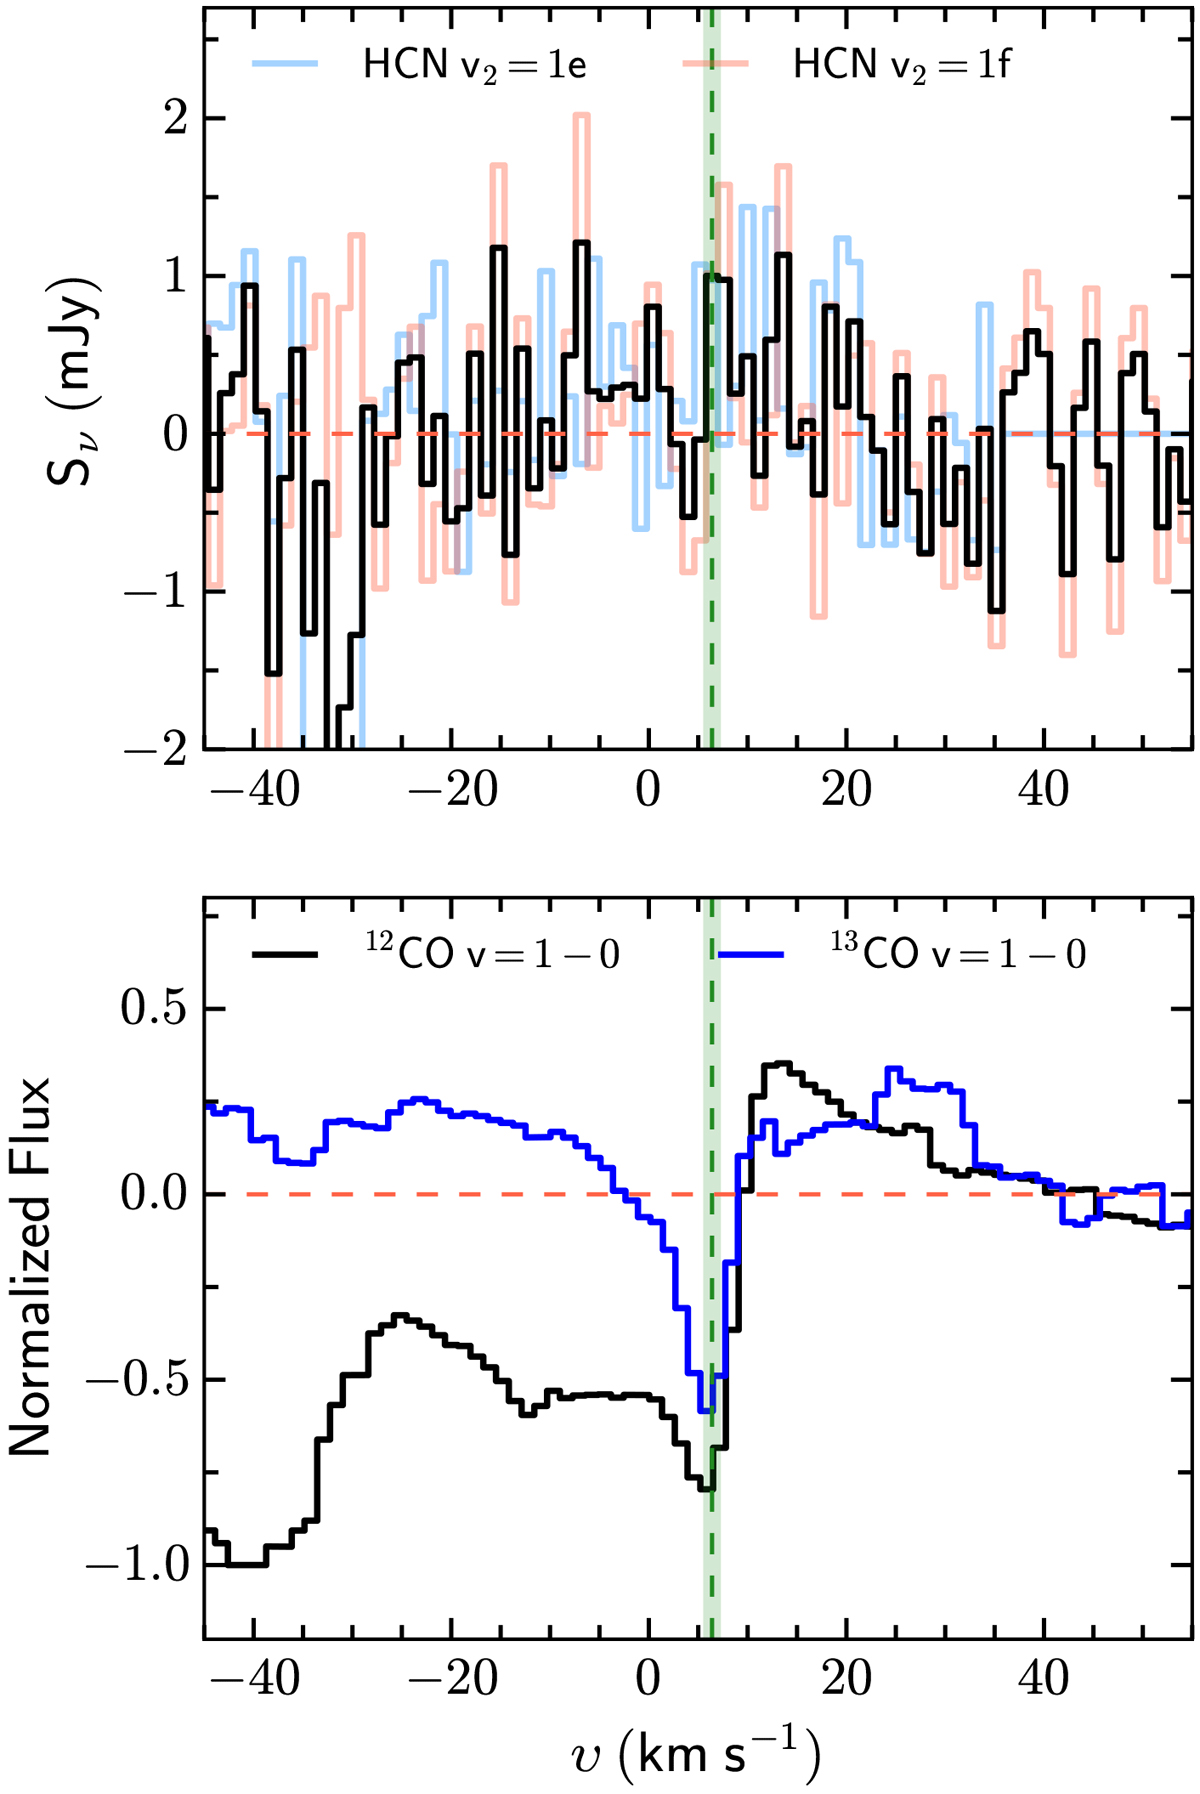
Top: HCN rovibrational spectra (v2 = 1 J = 3− 2 e∕f) observed with ALMA. The spectra are extracted from the inner 1″ region with red and blue denoting the e and f vibronic angular momentum quantum number, respectively. The black spectrum shows the stacked spectrum of the two lines, allowing a more stringent upper limit on the transition. Bottom: fundamental v = 1− 0 CO vibrational spectra taken with the VLT/CRIRES (Herczeg et al. 2011). The shown 12CO spectrum is the co-added rotational line profiles from R(3) to P(9), while the 13CO spectrum includes co-added R(10) to P(9). The green vertical solid line is the systemic velocity of the system, while the red horizontal dashed line indicates the baseline.
Current usage metrics show cumulative count of Article Views (full-text article views including HTML views, PDF and ePub downloads, according to the available data) and Abstracts Views on Vision4Press platform.
Data correspond to usage on the plateform after 2015. The current usage metrics is available 48-96 hours after online publication and is updated daily on week days.
Initial download of the metrics may take a while.