Free Access
Fig. 9
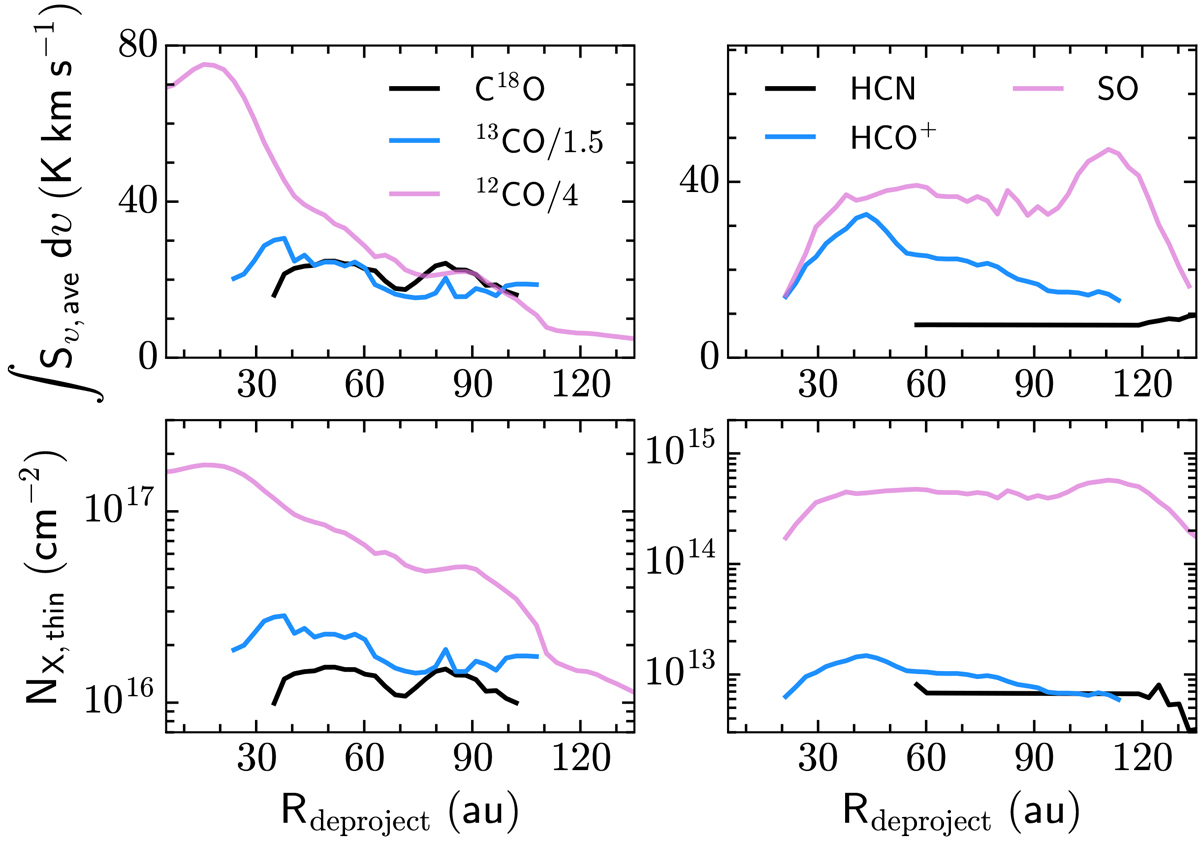
Azimuthally averaged, integrated line intensities (top) and column densities (bottom) as a function of the deprojected radius. The column densities are derived assuming optically thin molecular line emission, and an excitation temperature of 30 K. The deprojection utilizes the i and PA obtained in Sect. 3.1.
Current usage metrics show cumulative count of Article Views (full-text article views including HTML views, PDF and ePub downloads, according to the available data) and Abstracts Views on Vision4Press platform.
Data correspond to usage on the plateform after 2015. The current usage metrics is available 48-96 hours after online publication and is updated daily on week days.
Initial download of the metrics may take a while.