Fig. A.1
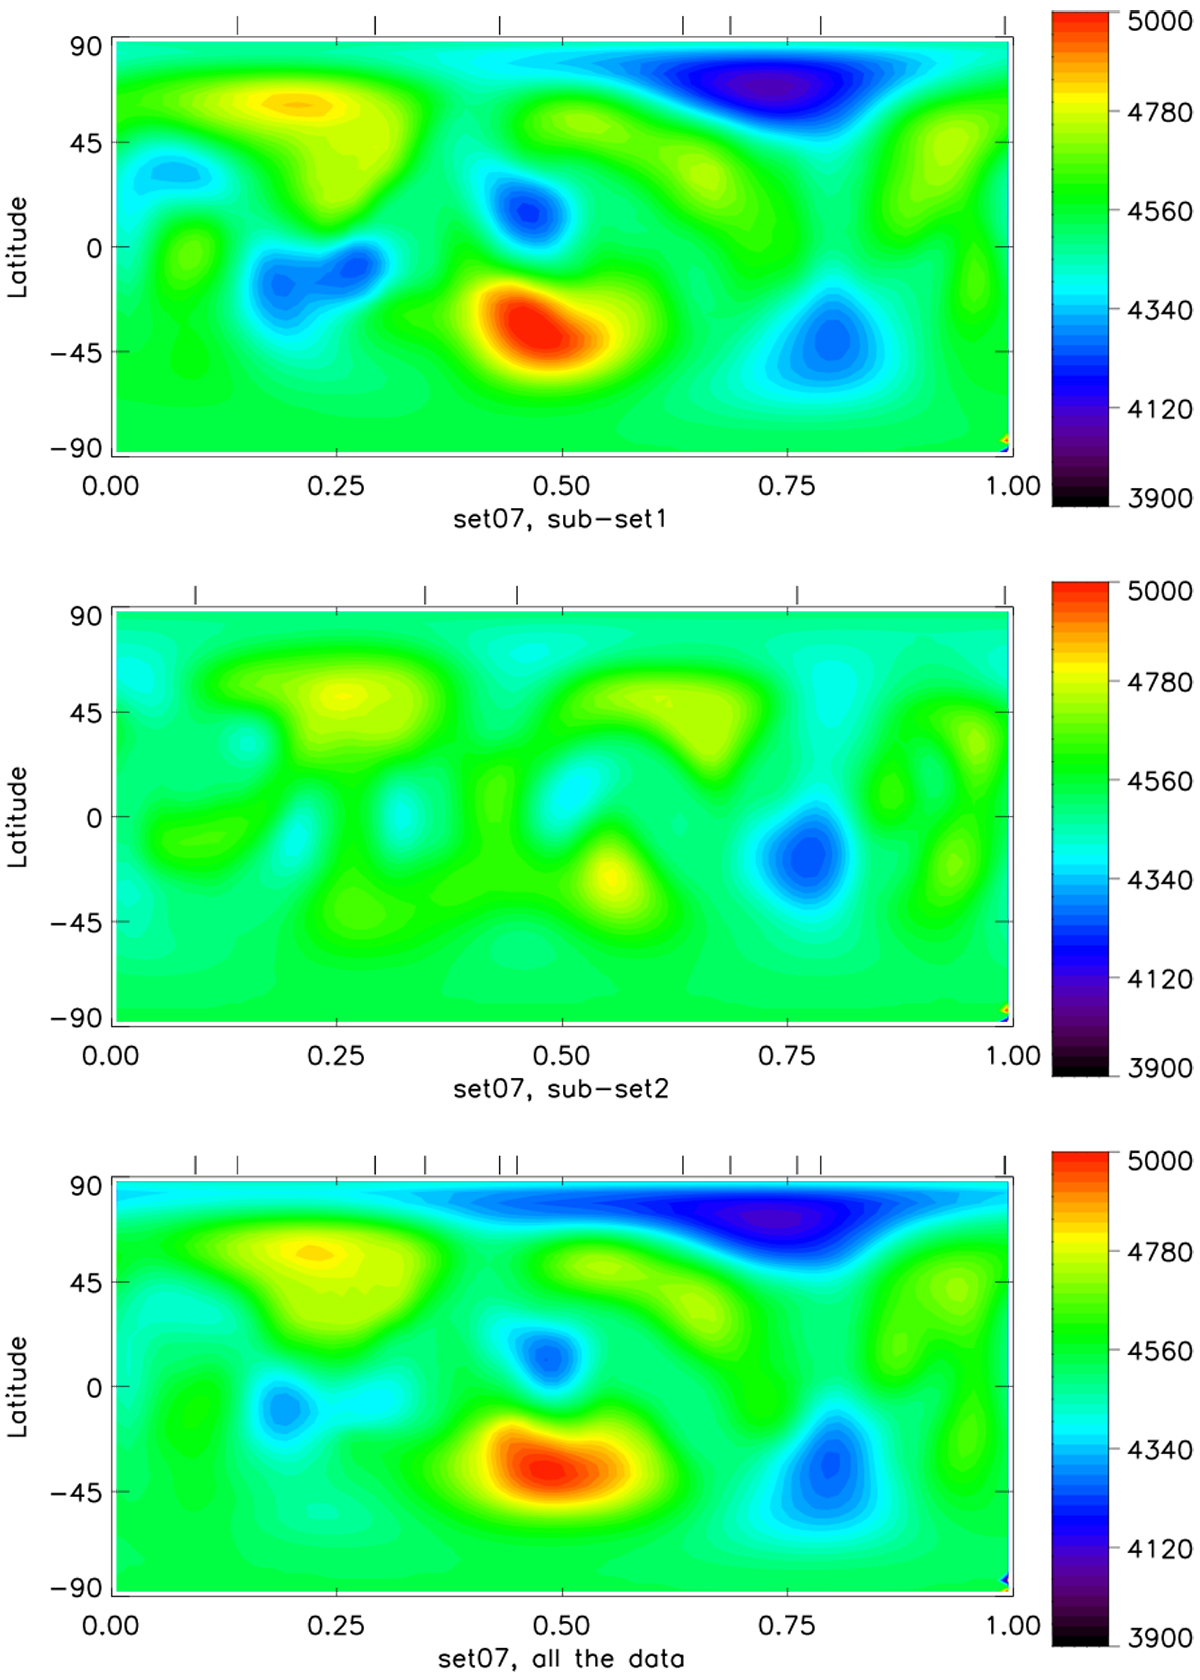
Doppler images of σ Gem obtained from set07 divided into two subsets at MJD = 57464 and using all the data together (set07 in our analysis). The data for subset1 were obtained at MJD = 57448–57464 and for the subset2 at MJD = 57464–57479. The x-axis is rotational phase, and the y-axis is spot latitude. The tick marks above each map denote the phases of the spectroscopic observations. The colour gives the temperature in Kelvin, as indicated by the colour scale next to the map. All the maps are plotted on the same temperaturescale.
Current usage metrics show cumulative count of Article Views (full-text article views including HTML views, PDF and ePub downloads, according to the available data) and Abstracts Views on Vision4Press platform.
Data correspond to usage on the plateform after 2015. The current usage metrics is available 48-96 hours after online publication and is updated daily on week days.
Initial download of the metrics may take a while.