Fig. 6.
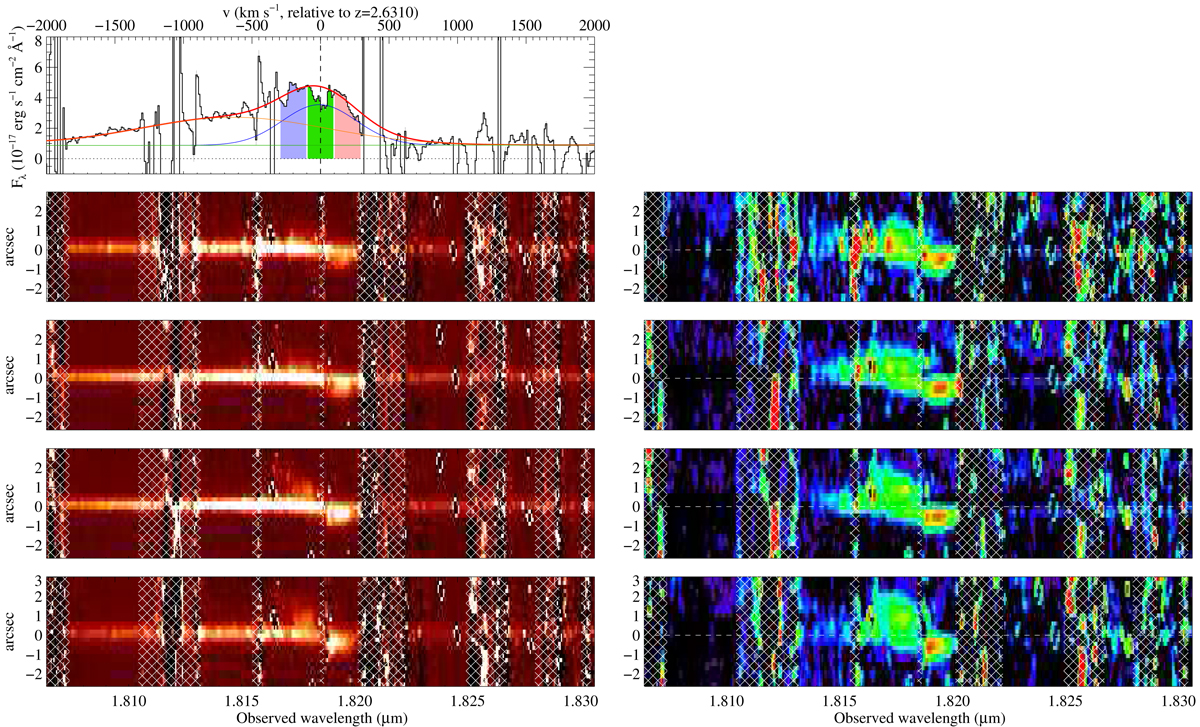
Individual 2D spectra around the [O III]λ5008 region (from top to bottom: PA = −155 deg, −164 deg, +177 deg, and +166 deg east of north, i.e. in these figures, north is down and south is up). The total observed emission is shown in the left panels, while the unresolved emission (continuum+broad component) has been subtracted in the right panels to better highlight the spatially-extended narrow [O III] emission alone. Each panel is 4000 km s−1 wide. The main skyline residuals are masked out by a white hashed grid. Top-left panel: total extracted 1D spectrum, with the corresponding Gaussian fits. The coloured regions show the velocity bins used in Fig. 7.
Current usage metrics show cumulative count of Article Views (full-text article views including HTML views, PDF and ePub downloads, according to the available data) and Abstracts Views on Vision4Press platform.
Data correspond to usage on the plateform after 2015. The current usage metrics is available 48-96 hours after online publication and is updated daily on week days.
Initial download of the metrics may take a while.