Fig. 10.
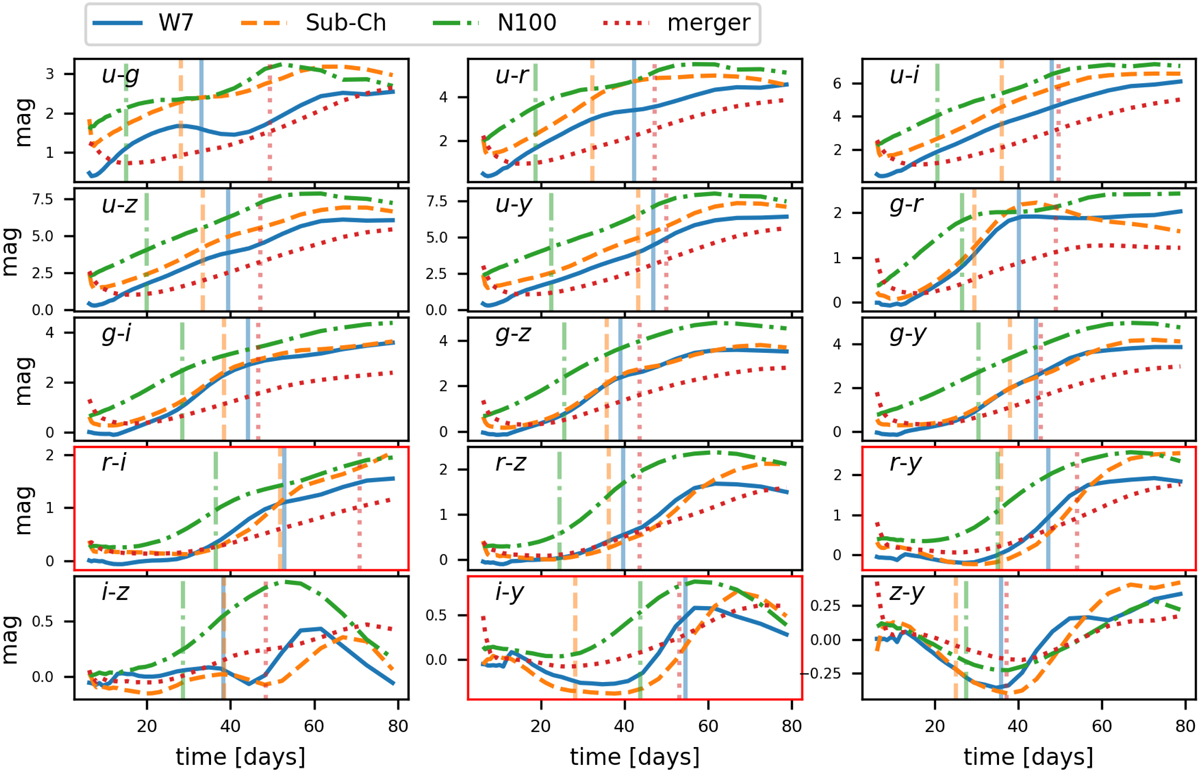
All redshifted (zs = 0.55) LSST color curves without microlensing for four different SN Ia models. The vertical lines mark the duration of the achromatic phase and red frames indicate color curves that are promising for time-delay measurements, in other words, color curves exhibiting features like extreme points or turning points that are located within the achromatic phase for at least three SNe Ia models.
Current usage metrics show cumulative count of Article Views (full-text article views including HTML views, PDF and ePub downloads, according to the available data) and Abstracts Views on Vision4Press platform.
Data correspond to usage on the plateform after 2015. The current usage metrics is available 48-96 hours after online publication and is updated daily on week days.
Initial download of the metrics may take a while.