Fig. 5.
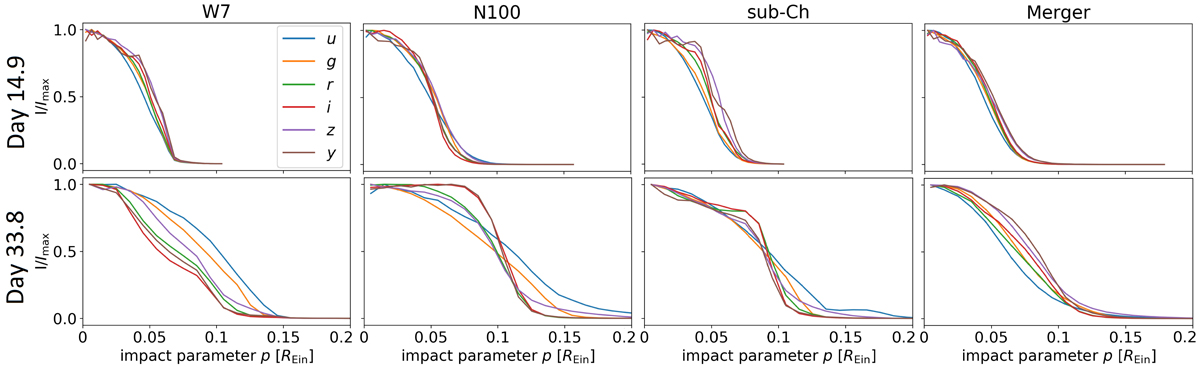
Radial specific intensity profiles for four SN Ia models (W7, N100, the sub-Ch, and the merger model in the four labeled columns) for the six LSST filters at rest-frame day 14.9 (top row) and day 33.8 (bottom row) after explosion, where REin = 2.9 × 1016 cm for the median source and lens redshifts (zs, zd = 0.77, 0.32) based on OM10. Different SN Ia models yield different specific intensity profiles, leading to different durations of the achromatic phase. The wiggles for low p values at day 14.9 are most likely due to Monte Carlos noise and we do not expect them to be physical. For our microlensing calculations, differences at higher p values are more relevant, since events where micro caustics are crossed become more likely with larger radius.
Current usage metrics show cumulative count of Article Views (full-text article views including HTML views, PDF and ePub downloads, according to the available data) and Abstracts Views on Vision4Press platform.
Data correspond to usage on the plateform after 2015. The current usage metrics is available 48-96 hours after online publication and is updated daily on week days.
Initial download of the metrics may take a while.