Fig. 7.
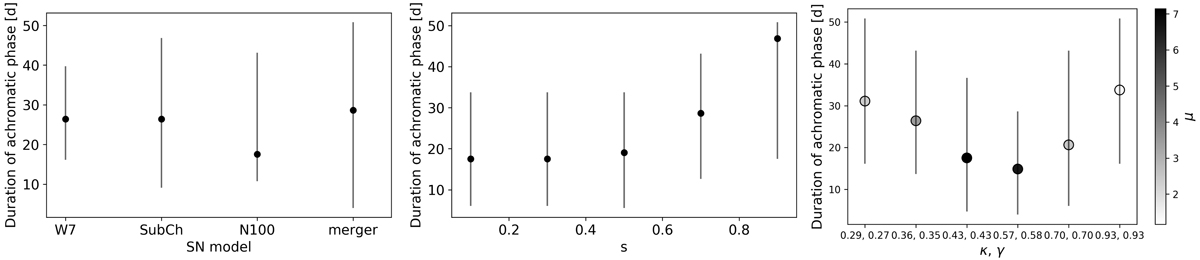
Duration of the achromatic phase in rest-frame days for different SN Ia models (left-hand panel), different smooth matter fractions s (middle panel), and image configurations from strong lensing with their respective magnification factors μ shown in the color bar (right-hand panel). For these plots, a sample of four models, six different κ and γ values, five different s values, and 15 color curves has been investigated where we average over all parameters not shown on the x-axis. The dots correspond to the median, and the vertical bars indicate the range from the 16th to 84th percentiles. Due to limits in computing time, we only investigated the achromatic phase up to rest-frame day 50.8; therefore, for cases close to that limit, the presented result are a lower limit on the achromatic phase. While the median achromatic phase is typically ≳20 rest-frame days, the spread due to different microlensing maps and color curves is quite large and the results can be seen in detail in Appendix B.
Current usage metrics show cumulative count of Article Views (full-text article views including HTML views, PDF and ePub downloads, according to the available data) and Abstracts Views on Vision4Press platform.
Data correspond to usage on the plateform after 2015. The current usage metrics is available 48-96 hours after online publication and is updated daily on week days.
Initial download of the metrics may take a while.