Fig. 8.
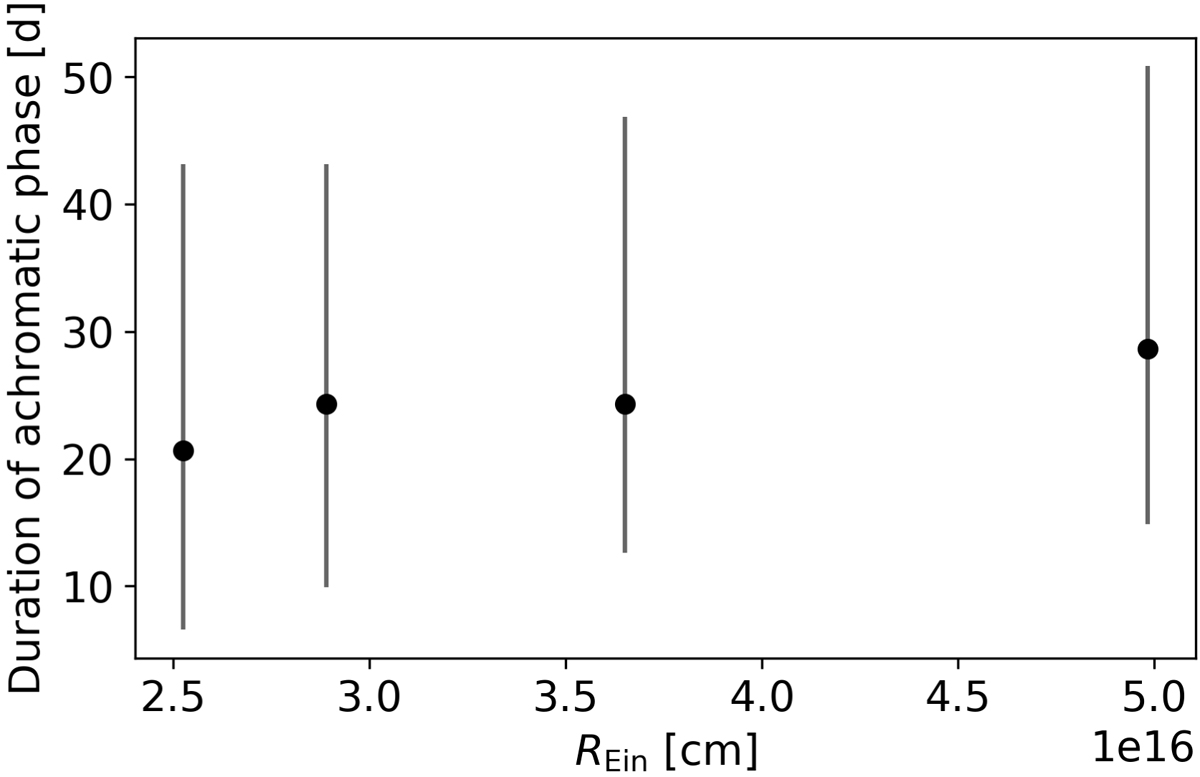
Duration of achromatic phase as a function of REin, the scale of variations in the microlensing map. The dots correspond to the median and the vertical bars indicate the range from the 16th to 84th percentile for the sample of four models, two different κ and γ pairs, five different s values, and 15 color curves that have been investigated, where we average over all parameters not shown on the x-axis. From left to right, REin corresponds to (zs, zd) = (0.99, 0.48),(0.77, 0.32),(0.55, 0.16),(0.99, 0.16).
Current usage metrics show cumulative count of Article Views (full-text article views including HTML views, PDF and ePub downloads, according to the available data) and Abstracts Views on Vision4Press platform.
Data correspond to usage on the plateform after 2015. The current usage metrics is available 48-96 hours after online publication and is updated daily on week days.
Initial download of the metrics may take a while.