Fig. 5.
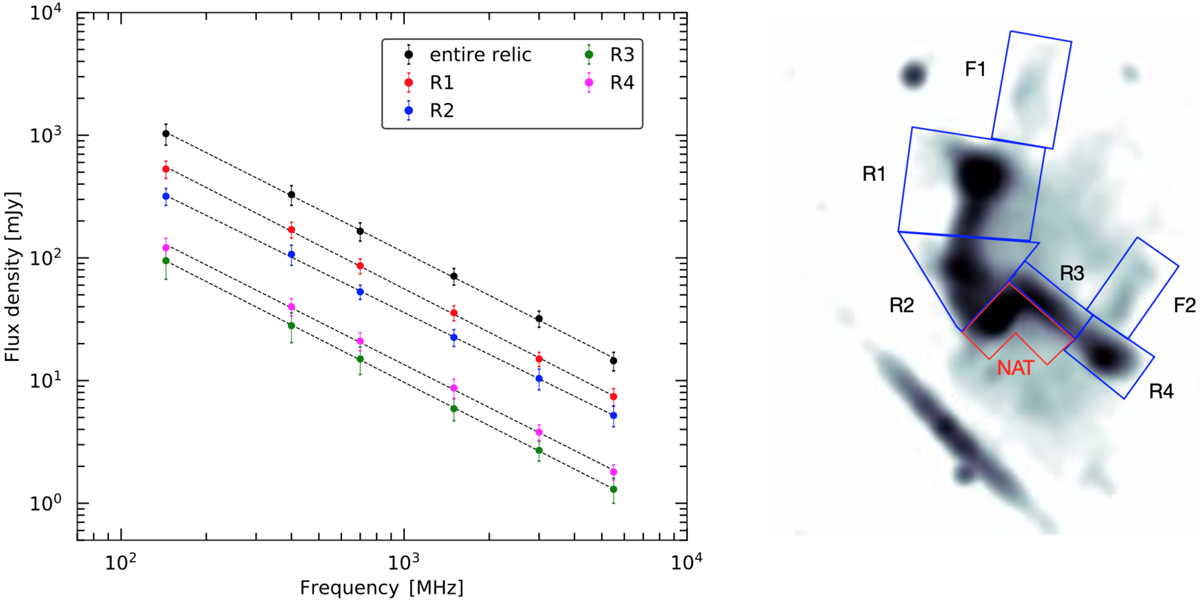
Left: integrated spectra of the chair-shaped relic and its subregions from 144 MHz to 5.5 GHz. The overall spectrum of the entire relic is well-described by a single power law with the slope of α = −1.16 ± 0.03. The subregions also follow a power-law distribution and show similar spectral slopes. The total flux density of the relic and R3 is obtained after masking the contribution from the NAT (shown with red box). Right: blue regions indicate areas from which the flux densities were extracted to obtain the integrated spectra of the relic and its subregions.
Current usage metrics show cumulative count of Article Views (full-text article views including HTML views, PDF and ePub downloads, according to the available data) and Abstracts Views on Vision4Press platform.
Data correspond to usage on the plateform after 2015. The current usage metrics is available 48-96 hours after online publication and is updated daily on week days.
Initial download of the metrics may take a while.