Fig. 15
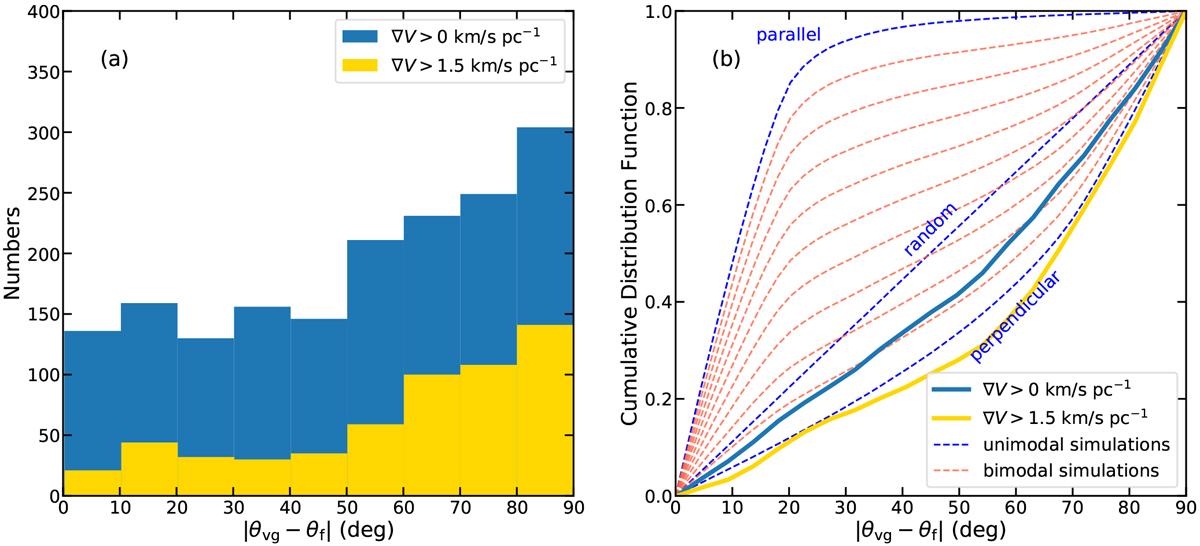
(a) Histograms of the angle of the vector of the observed local velocity gradient relative to the long axis of the filament. The blue histograms show all the angles of the observed velocity gradients in SE, while the yellow histograms represent the velocity gradients with |∇V | >1.5 km s−1 pc−1. (b) Cumulative distribution function of the angle between the velocity gradients and the major axis of the filament. The solid blue and yellow lines represent the observed cumulative distribution function of relative angles with corresponding and |∇V | >1.5 km s−1 pc−1 and |∇V | >1.5 km s−1 pc−1, respectively. The three blue dashed lines present the unimodal simulations of the expected angles which are three-dimensionally parallel (0–20°), perpendicular (70–90°), or random (0–90°), while the red dashed lines show the bimodal simulations of the angles that are parallel and perpendicular with increments of 10% (i.e., the top red line is 90% parallel and 10% perpendicular, the next one is 80% parallel and 20% perpendicular).
Current usage metrics show cumulative count of Article Views (full-text article views including HTML views, PDF and ePub downloads, according to the available data) and Abstracts Views on Vision4Press platform.
Data correspond to usage on the plateform after 2015. The current usage metrics is available 48-96 hours after online publication and is updated daily on week days.
Initial download of the metrics may take a while.