Free Access
Fig. 10.
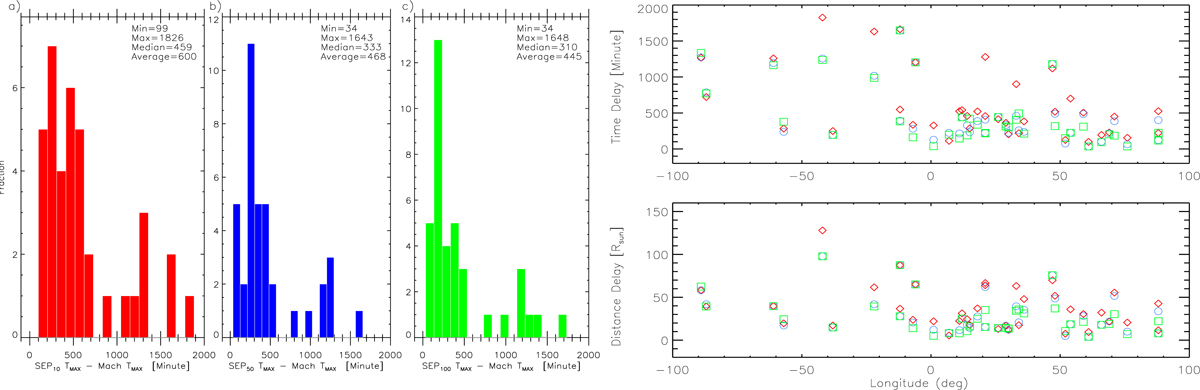
Distribution showing the time difference between SEP peak flux and maximum Mach number. Left: panel a for > 10 MeV (red), panel b for > 50 MeV (blue), and panel c for > 100 MeV (green). Right: variation of the time and distance delay with longitude.
Current usage metrics show cumulative count of Article Views (full-text article views including HTML views, PDF and ePub downloads, according to the available data) and Abstracts Views on Vision4Press platform.
Data correspond to usage on the plateform after 2015. The current usage metrics is available 48-96 hours after online publication and is updated daily on week days.
Initial download of the metrics may take a while.