Fig. 2.
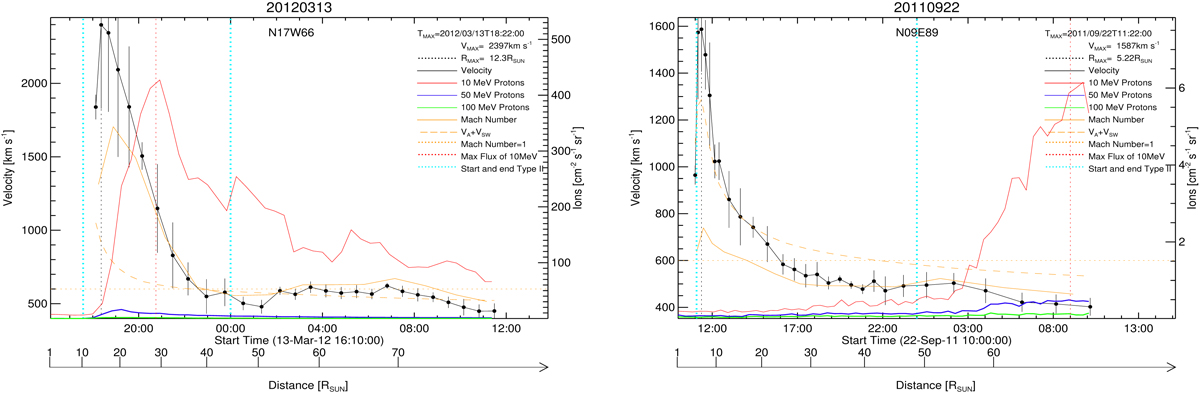
13 March 2012 event located at the west limb (left panel) and 22 September 2011 event located at the east limb (right panel). The plot shows the CME speed from STEREO (black line) with error bars, SEP flux in the > 10 MeV energy band (red line), > 50 MeV energy band (blue line), and > 100 MeV energy band (green line). The sum of Alfvén and solar wind speed [VA + VSW] (dashed orange line) and the scaled Mach number (orange line) are shown. The start and end times of the associated type II burst are added (dotted cyan line). The CME maximum velocity [VMAX] and time [TMAX] and the distance at CME peak velocity [RMAX] (dotted black line) at VMAX, SEP peak flux in the > 10 MeV energy band (dotted red line), and the scaled Mach number = 1 (dotted orange line) are shown in the figure.
Current usage metrics show cumulative count of Article Views (full-text article views including HTML views, PDF and ePub downloads, according to the available data) and Abstracts Views on Vision4Press platform.
Data correspond to usage on the plateform after 2015. The current usage metrics is available 48-96 hours after online publication and is updated daily on week days.
Initial download of the metrics may take a while.