Free Access
Fig. 6.
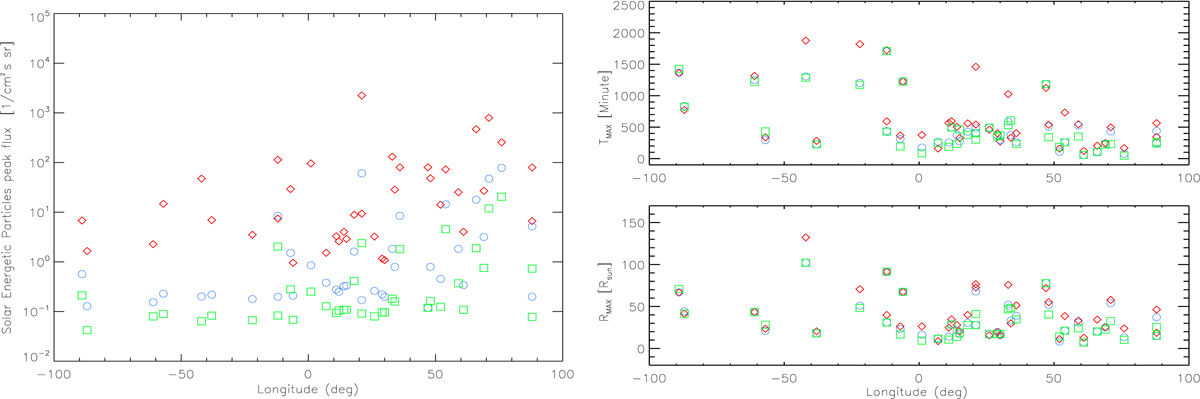
Scatter plot of longitude of the solar flare associated with the respective CMEs vs SEP peak flux (left panel) and the time and distance at which SEPs reach peak flux (right panels). Colors are assigned to the SEPs in the energy channels: > 10 MeV (red), > 50 MeV (blue), and > 100 MeV (green).
Current usage metrics show cumulative count of Article Views (full-text article views including HTML views, PDF and ePub downloads, according to the available data) and Abstracts Views on Vision4Press platform.
Data correspond to usage on the plateform after 2015. The current usage metrics is available 48-96 hours after online publication and is updated daily on week days.
Initial download of the metrics may take a while.