Fig. 2.
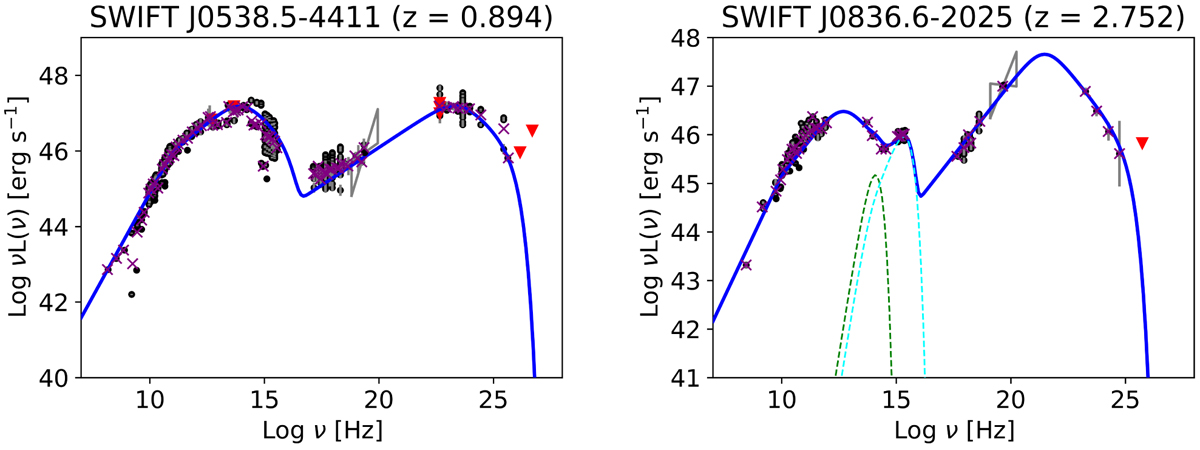
Spectral energy distribution fit (blue line) for two beamed AGN sources. The black dots indicate archival data, the error bars are shown in gray, the red pointers represent the upper limits, and the purple crosses depict the mean flux in a 0.1 width logarithmic bin of frequency. The model considers a phenomenological description of the jet emission for blazar-like sources with the optional addition of an emitting thin accretion disk (cyan dashed line) and an obscuring torus (green dashed line).
Current usage metrics show cumulative count of Article Views (full-text article views including HTML views, PDF and ePub downloads, according to the available data) and Abstracts Views on Vision4Press platform.
Data correspond to usage on the plateform after 2015. The current usage metrics is available 48-96 hours after online publication and is updated daily on week days.
Initial download of the metrics may take a while.