Fig. 5.
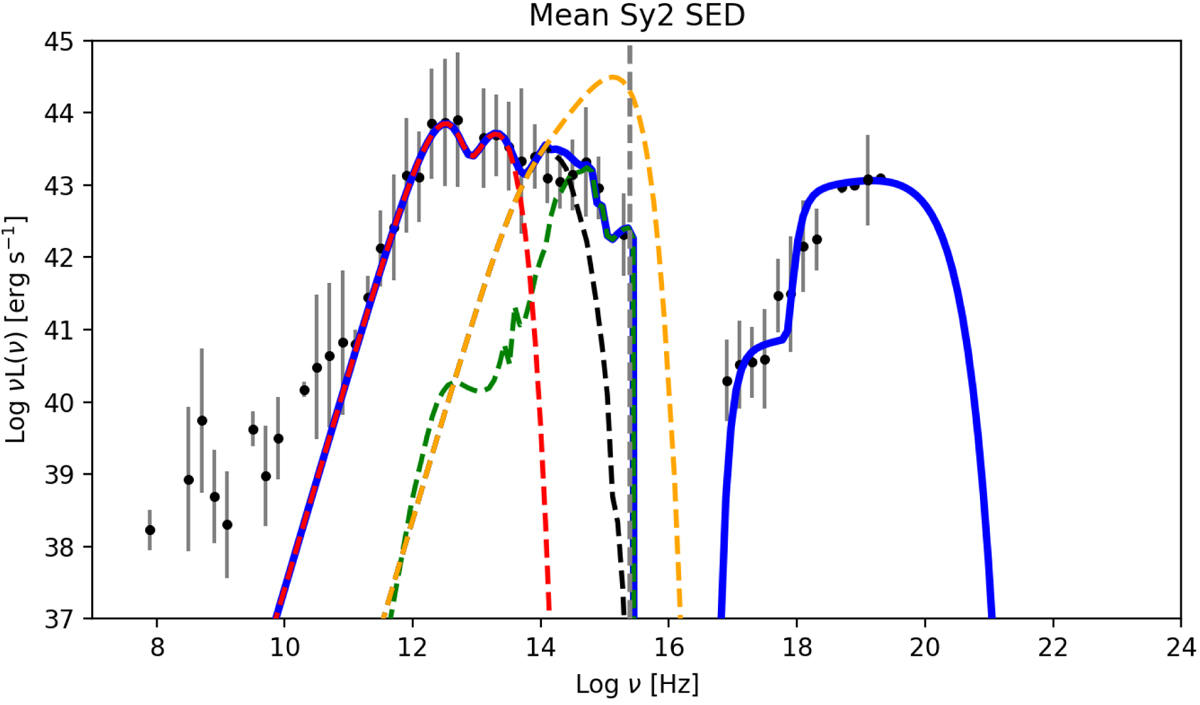
Spectral energy distribution fit (blue line) of the mean spectra of the 20 Seyfert 2 sources in the BAT catalog with the highest flux. The black dots indicate archival data, the error bars are shown in gray, the red pointers represent upper limits, and the purple crosses depict the mean flux in a 0.1 width logarithmic bin of frequency. The model fit (blue line) considers absorption at keV energies and in the optical band. The orange dashed line represents the unabsorbed emission from the accretion disk, the black dashed line indicates the optical absorbed disk emission, the green dashed line indicates the galactic template, and the red dashed line represents the sum of the emission from the dust belt and the obscuring torus. The gray vertical dashed line indicates the hydrogen Lyα frequency.
Current usage metrics show cumulative count of Article Views (full-text article views including HTML views, PDF and ePub downloads, according to the available data) and Abstracts Views on Vision4Press platform.
Data correspond to usage on the plateform after 2015. The current usage metrics is available 48-96 hours after online publication and is updated daily on week days.
Initial download of the metrics may take a while.