Fig. 6.
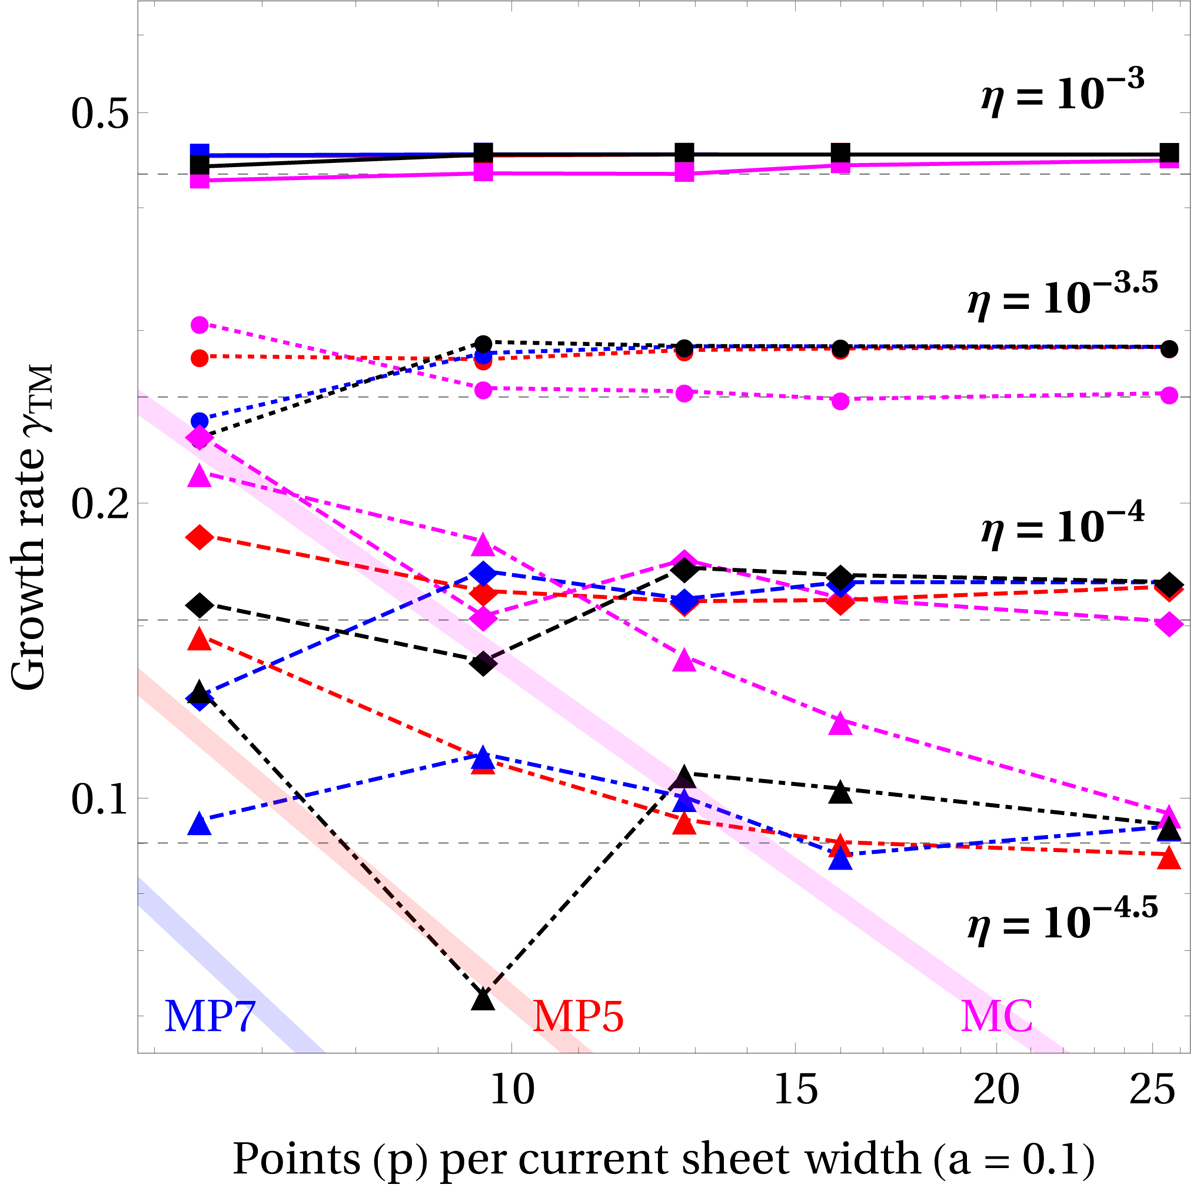
Measured growth rates for simulations using different resistivity parameters η in the resistive current density, Eq. (29), and for different reconstruction schemes (MC: magenta, MP5: red, MP7: blue, MP9: black) as a function of the numerical resolution. Thick lines in the background show the fits obtained in Sect. 2.2 for numerical simulations without any added resistivity (see Fig. 3). As η is lowered, the effect of numerical resistivity emerges (especially in the bottom left corner of the panel). Dashed gray lines mark the values of the growth rates corresponding to the values of η used in the different series of simulations, computed using Eq. (19).
Current usage metrics show cumulative count of Article Views (full-text article views including HTML views, PDF and ePub downloads, according to the available data) and Abstracts Views on Vision4Press platform.
Data correspond to usage on the plateform after 2015. The current usage metrics is available 48-96 hours after online publication and is updated daily on week days.
Initial download of the metrics may take a while.