Fig. 2.
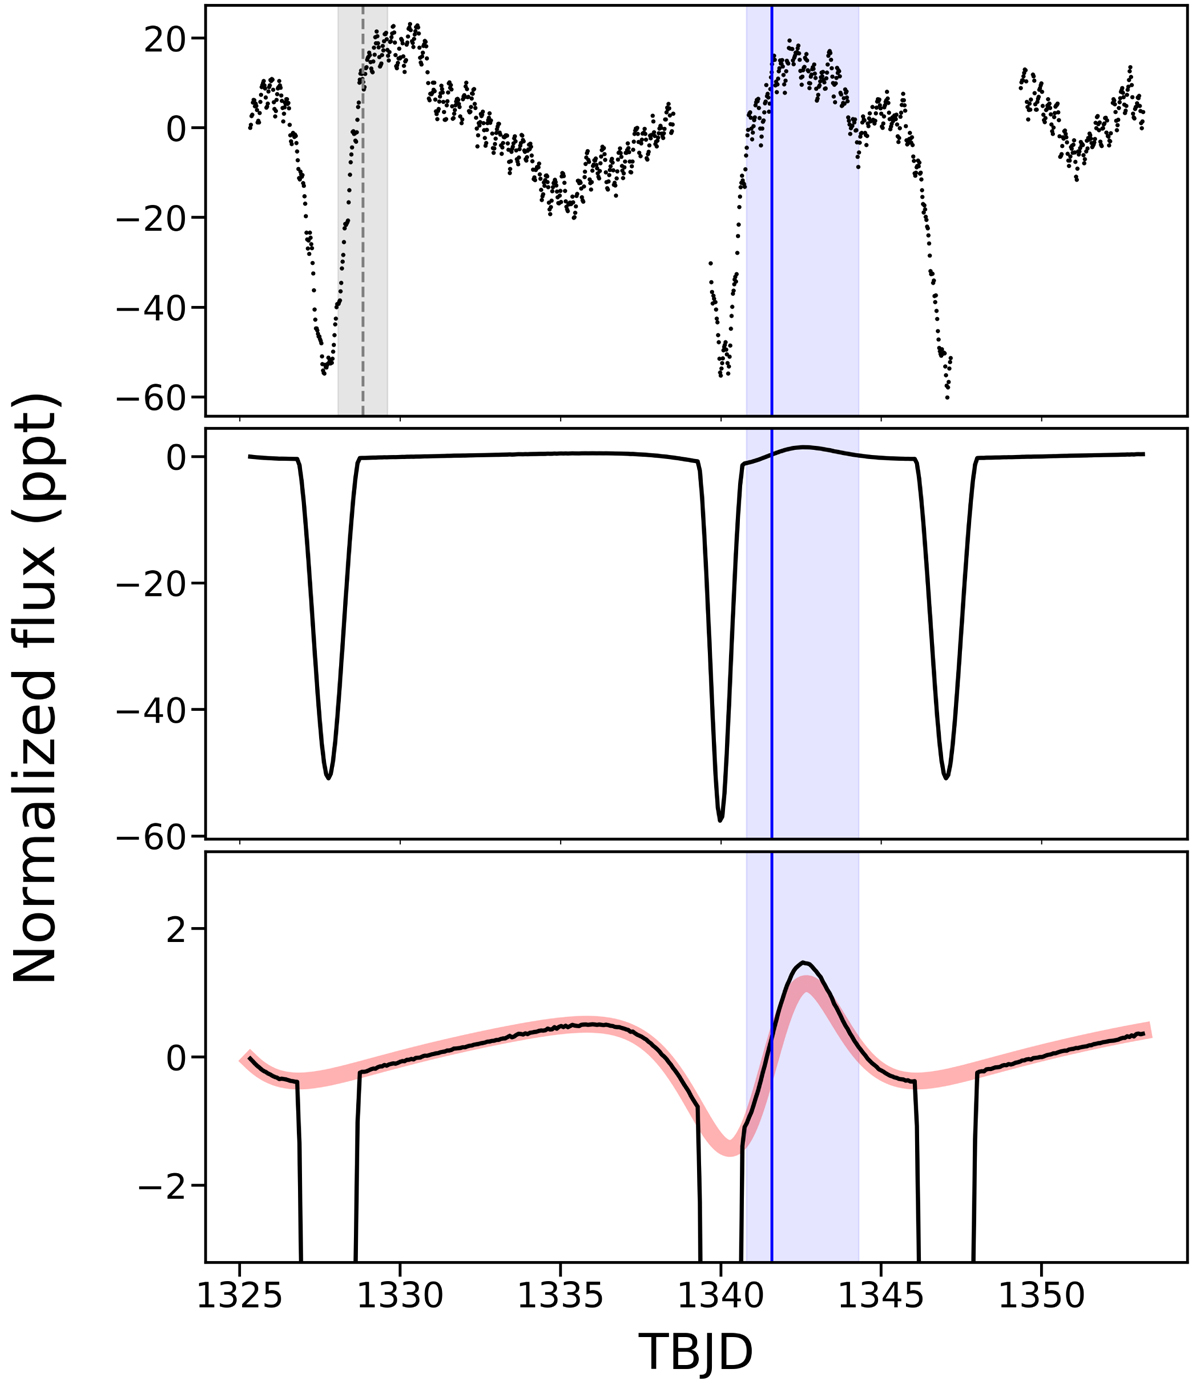
Top: TESS light curve of HD 5980. The continuous and dashed vertical lines mark times of the periastron passage of the A–B and C–D systems, respectively, both calculated from the ephemerides given by Koenigsberger et al. (2014). For the latter system, shaded band stands for ±1σ error. Middle: PHOEBE 2 model of the TESS light curve of HD 5980. Details of modelling are given in the text. Bottom: zoom of the model shown in the middle panel. For comparison, Kumar’s model generated with the same orbital parameters is shown with the light red line.
Current usage metrics show cumulative count of Article Views (full-text article views including HTML views, PDF and ePub downloads, according to the available data) and Abstracts Views on Vision4Press platform.
Data correspond to usage on the plateform after 2015. The current usage metrics is available 48-96 hours after online publication and is updated daily on week days.
Initial download of the metrics may take a while.