Fig. 10.
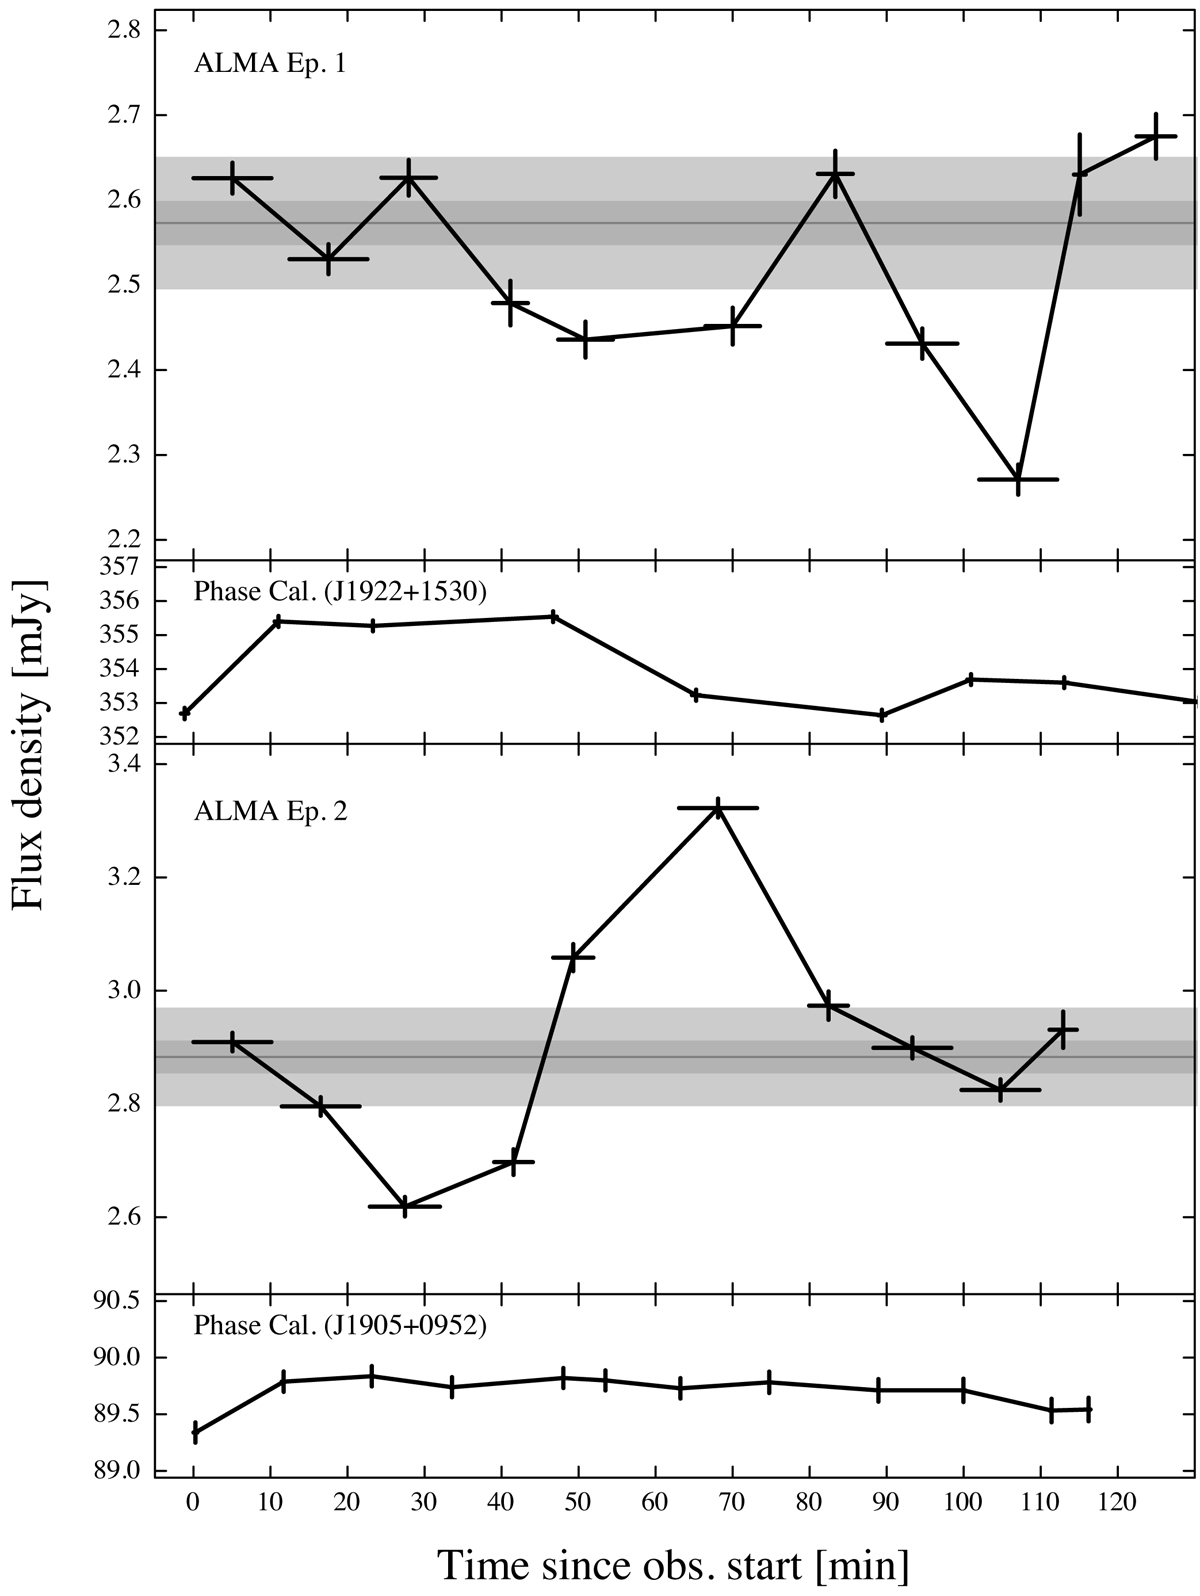
Band 3 light curve from the two ALMA epochs in time bins of one scan length (∼10 min). Top two panels: data from Epoch 1 and the bottom two panels from Epoch 2 for GRS 1915+105 and the phase calibrators J1922+1530 and J1905+0952. The horizontal lines and the gray bands show the mean value of the flux density throughout the epochs as tabulated in Table 2.
Current usage metrics show cumulative count of Article Views (full-text article views including HTML views, PDF and ePub downloads, according to the available data) and Abstracts Views on Vision4Press platform.
Data correspond to usage on the plateform after 2015. The current usage metrics is available 48-96 hours after online publication and is updated daily on week days.
Initial download of the metrics may take a while.