Fig. 1.
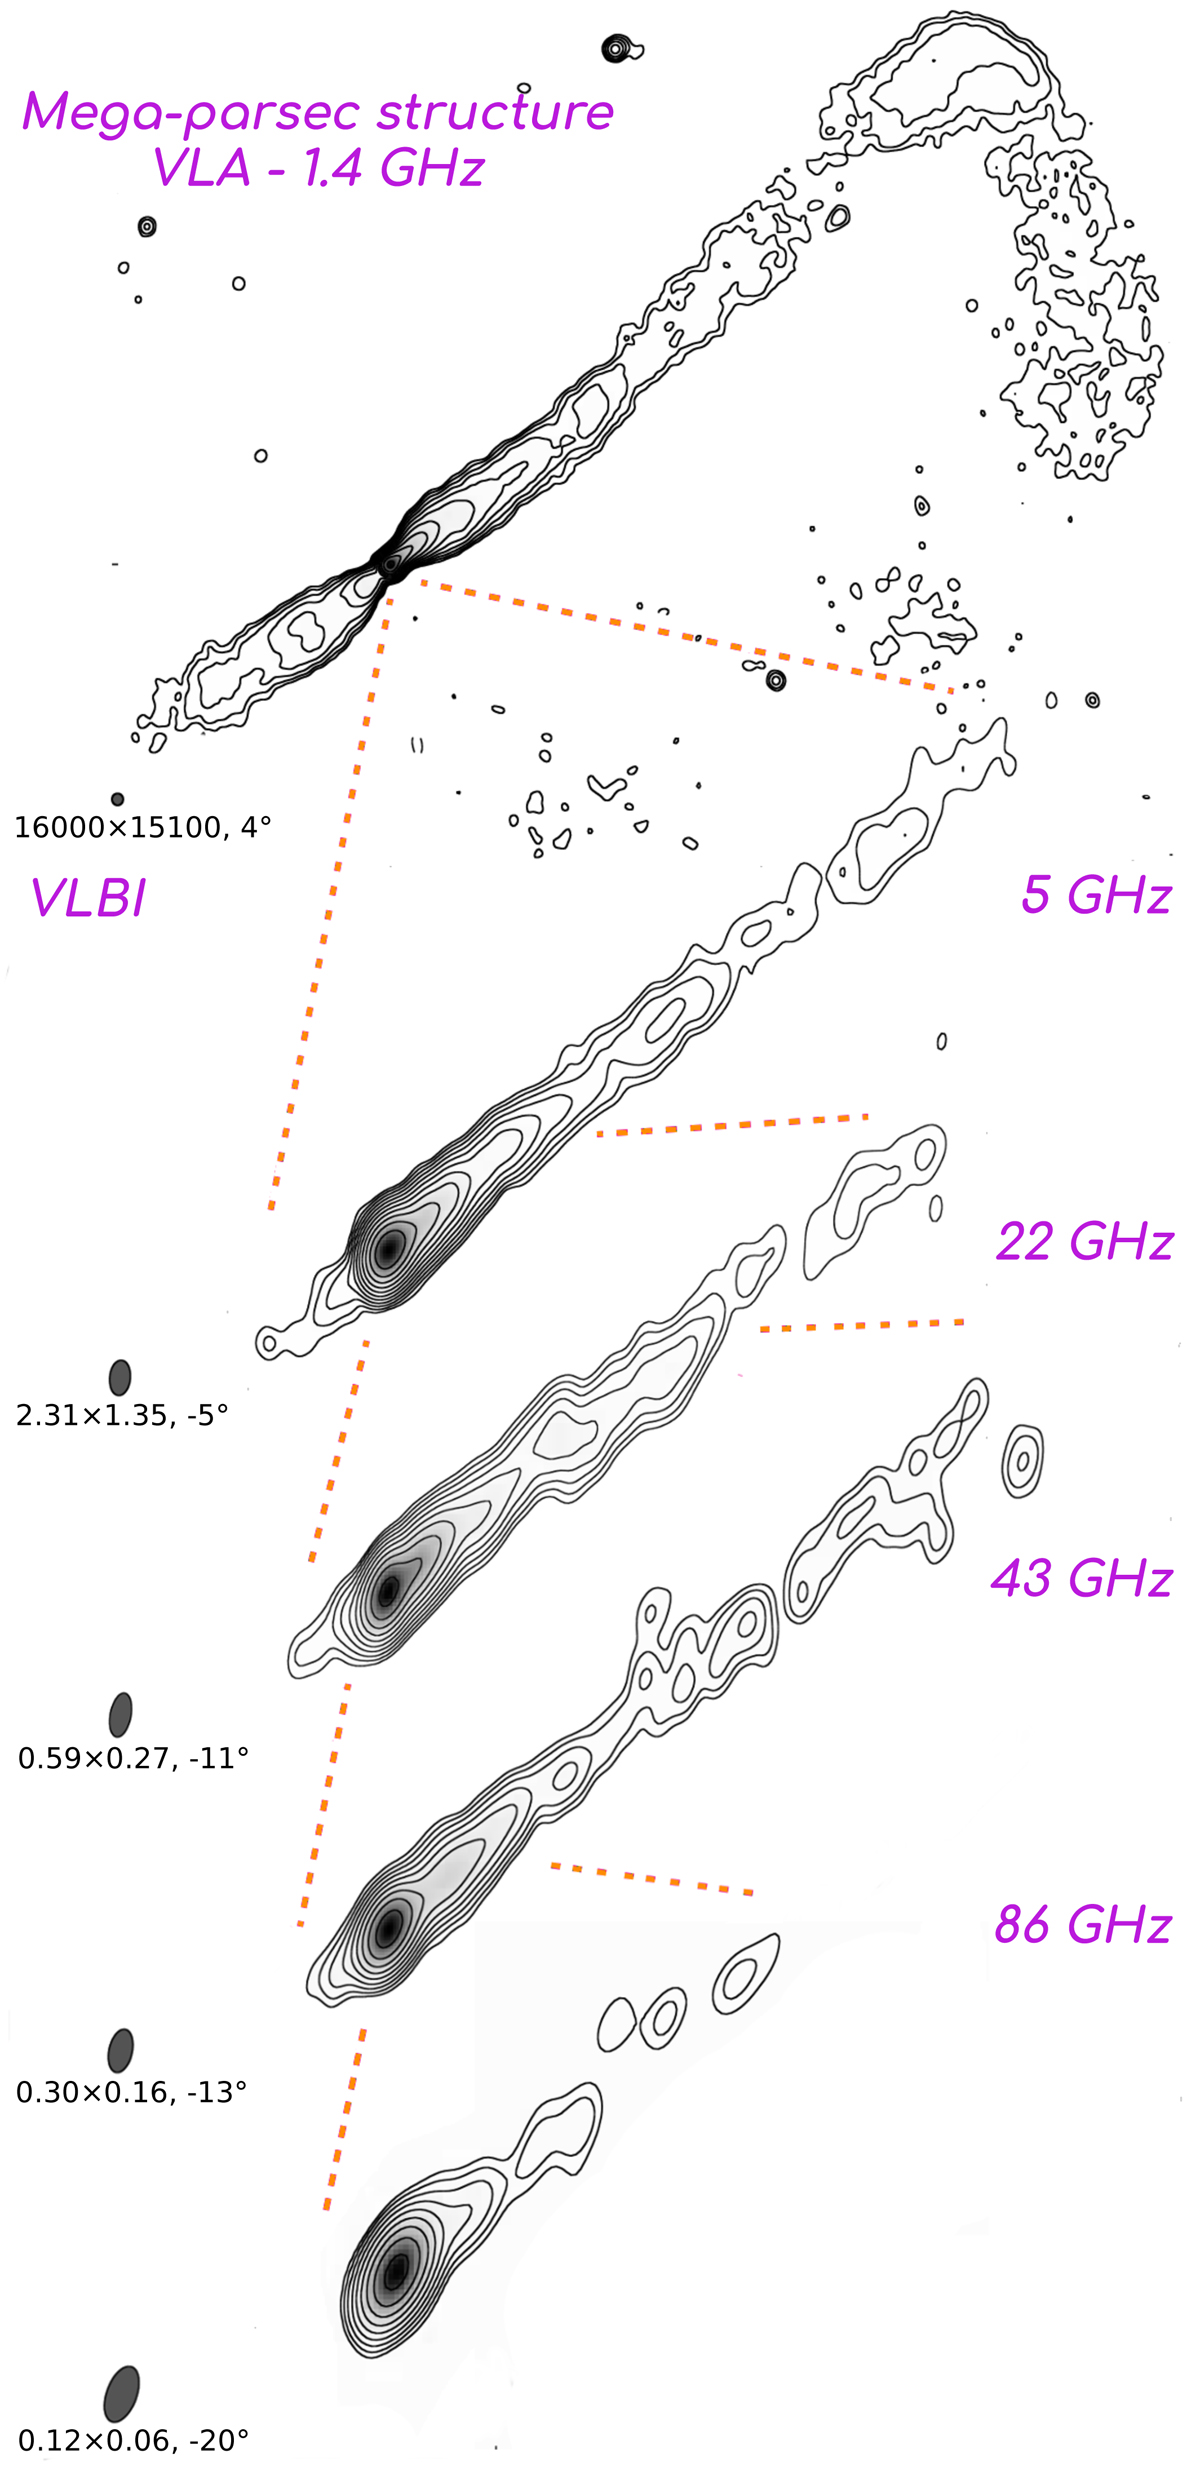
Jet structure of NGC 315 from Mega-parsec to sub-parsec scales. The top image was obtained based on VLA data at 1.4 GHz, while the rest of the maps show the VLBI structure at different frequencies (5 GHz, 22 GHz, 43 GHz, 86 GHz) based on some of analyzed the data presented in Sect. 2, Table 1. The complete series of images considered in the article is presented in the appendix.
Current usage metrics show cumulative count of Article Views (full-text article views including HTML views, PDF and ePub downloads, according to the available data) and Abstracts Views on Vision4Press platform.
Data correspond to usage on the plateform after 2015. The current usage metrics is available 48-96 hours after online publication and is updated daily on week days.
Initial download of the metrics may take a while.