Fig. 8.
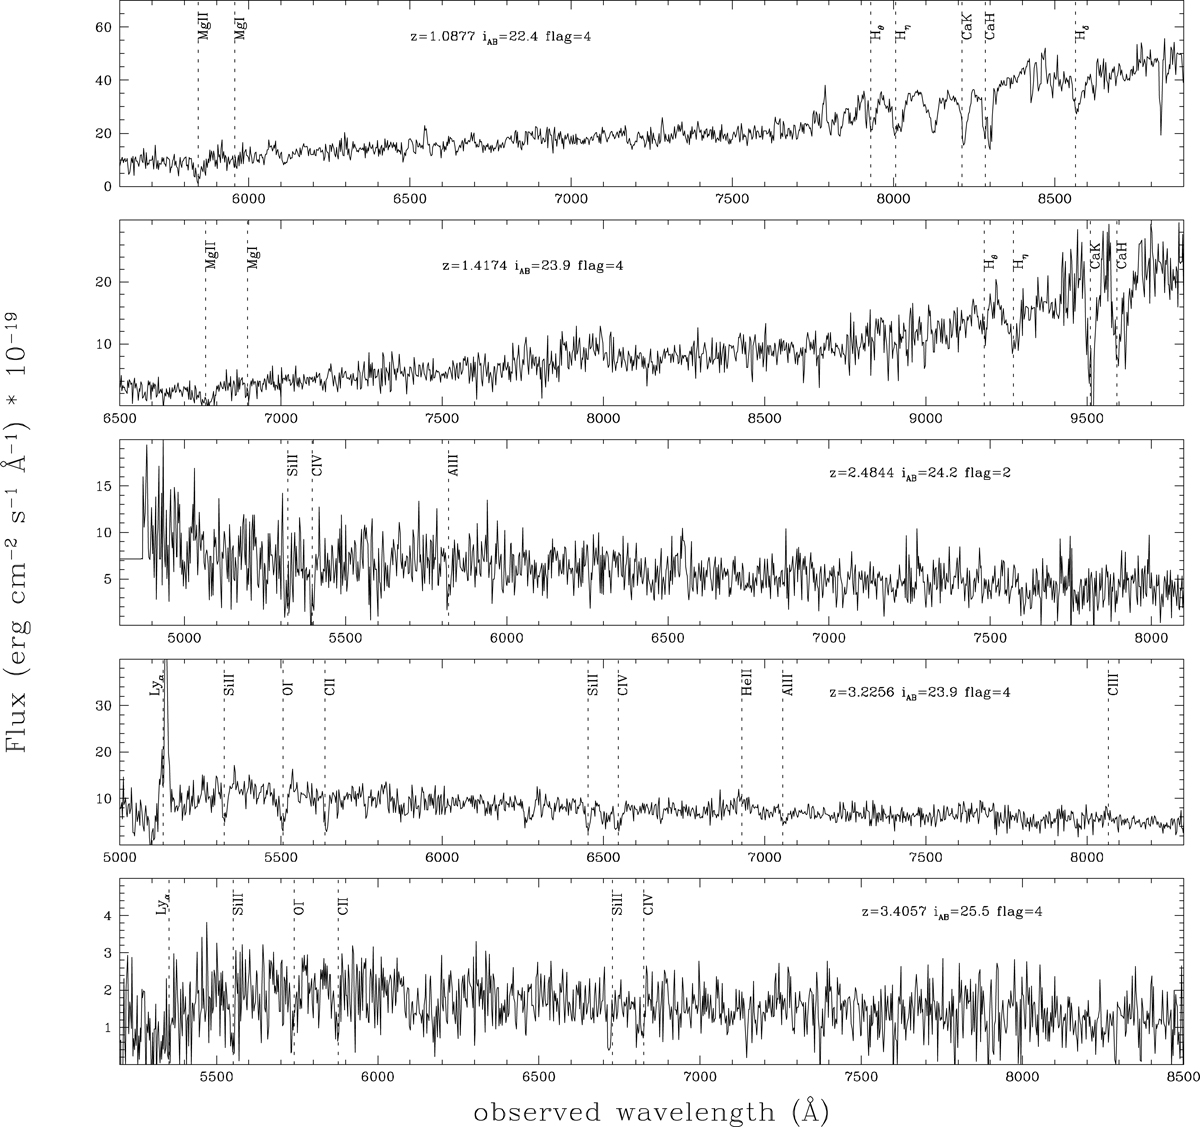
Examples of VANDELS spectra of galaxies drawn from different subsamples, magnitudes, and redshift ranges. A zoom into the spectra is shown around the region containing the most prominent lines, according to the galaxy redshift. From top to bottom: two passive galaxies and three SF galaxies. The redshift, magnitude, and reliability flag for each galaxy are indicated in each panel.
Current usage metrics show cumulative count of Article Views (full-text article views including HTML views, PDF and ePub downloads, according to the available data) and Abstracts Views on Vision4Press platform.
Data correspond to usage on the plateform after 2015. The current usage metrics is available 48-96 hours after online publication and is updated daily on week days.
Initial download of the metrics may take a while.