Fig. 2
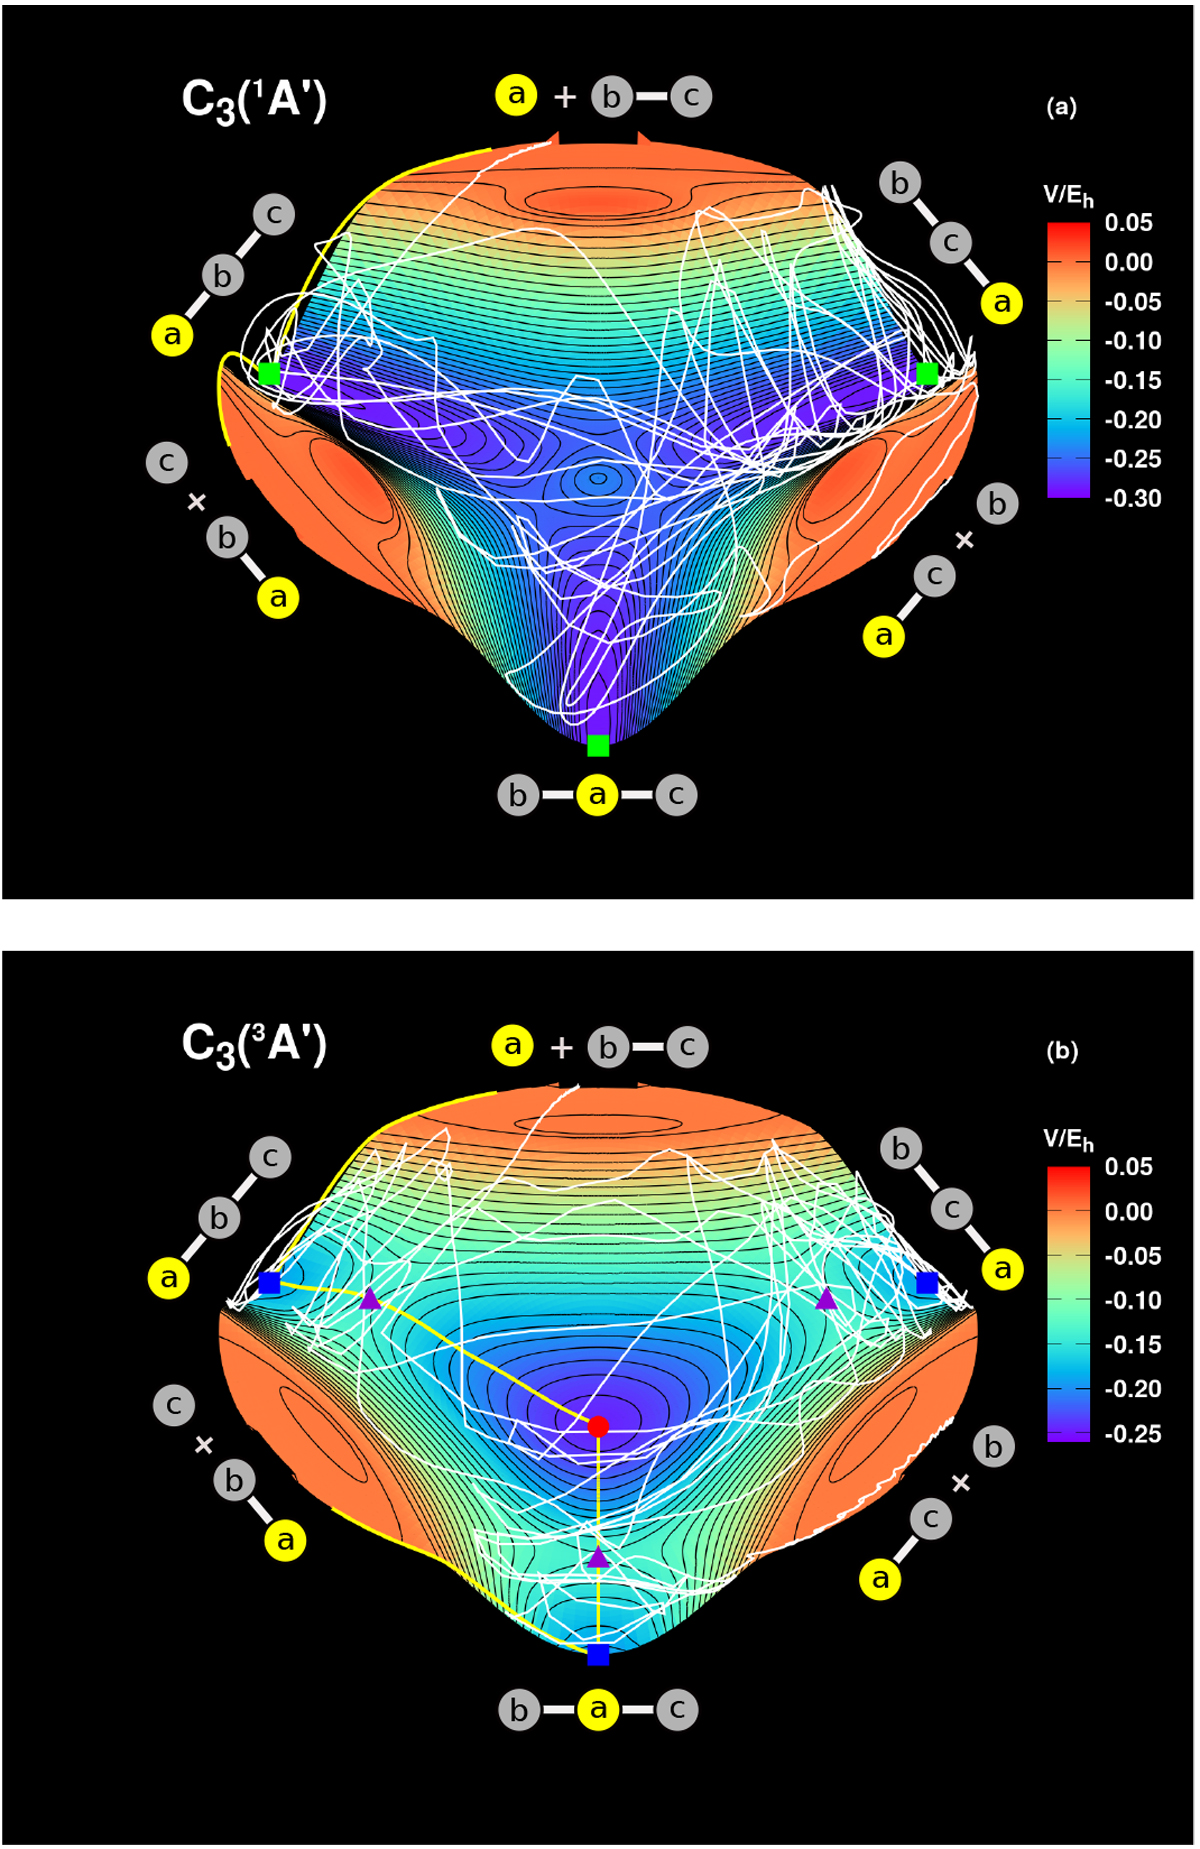
Relaxed 3D plots in hyperspherical coordinates (Varandas 1987) of the nuclear-mass-independent PESs of ground-state (a) ![]() and (b)
and (b) ![]() . The zero of energy is set relative to the infinitely separated C+C2
fragments. Stationary points and minimum energy paths (solid yellow lines) as in Fig. 1. Solid white lines show the time evolution (in coordinate space) of sample reactive trajectories for the processes (a)
. The zero of energy is set relative to the infinitely separated C+C2
fragments. Stationary points and minimum energy paths (solid yellow lines) as in Fig. 1. Solid white lines show the time evolution (in coordinate space) of sample reactive trajectories for the processes (a)![]() and (b)
and (b) ![]() . An isotopically distinct carbon atom is schematically represented in yellow.
. An isotopically distinct carbon atom is schematically represented in yellow.
Current usage metrics show cumulative count of Article Views (full-text article views including HTML views, PDF and ePub downloads, according to the available data) and Abstracts Views on Vision4Press platform.
Data correspond to usage on the plateform after 2015. The current usage metrics is available 48-96 hours after online publication and is updated daily on week days.
Initial download of the metrics may take a while.