Free Access
Fig. 3.
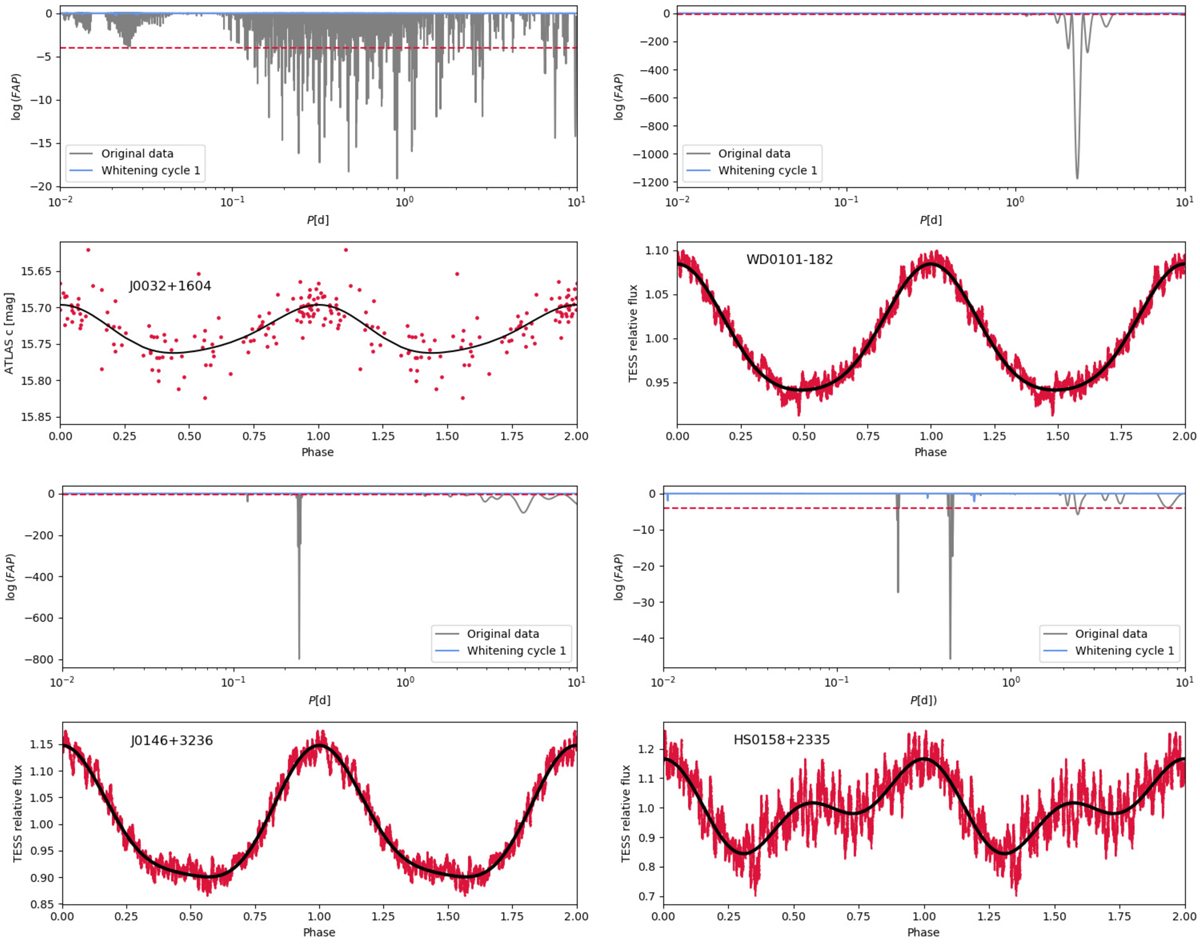
Periodograms and phase-folded light curves of the UHE white dwarfs J0032+1604, WD 0101−182, J0146+3236, and HS 0158+2335. The red solid lines are phase-averaged light curves, while the dotted light curve represents the actual data. The black line is a fit of a harmonic series used to predict the peak-to-peak amplitude.
Current usage metrics show cumulative count of Article Views (full-text article views including HTML views, PDF and ePub downloads, according to the available data) and Abstracts Views on Vision4Press platform.
Data correspond to usage on the plateform after 2015. The current usage metrics is available 48-96 hours after online publication and is updated daily on week days.
Initial download of the metrics may take a while.