Fig. 4
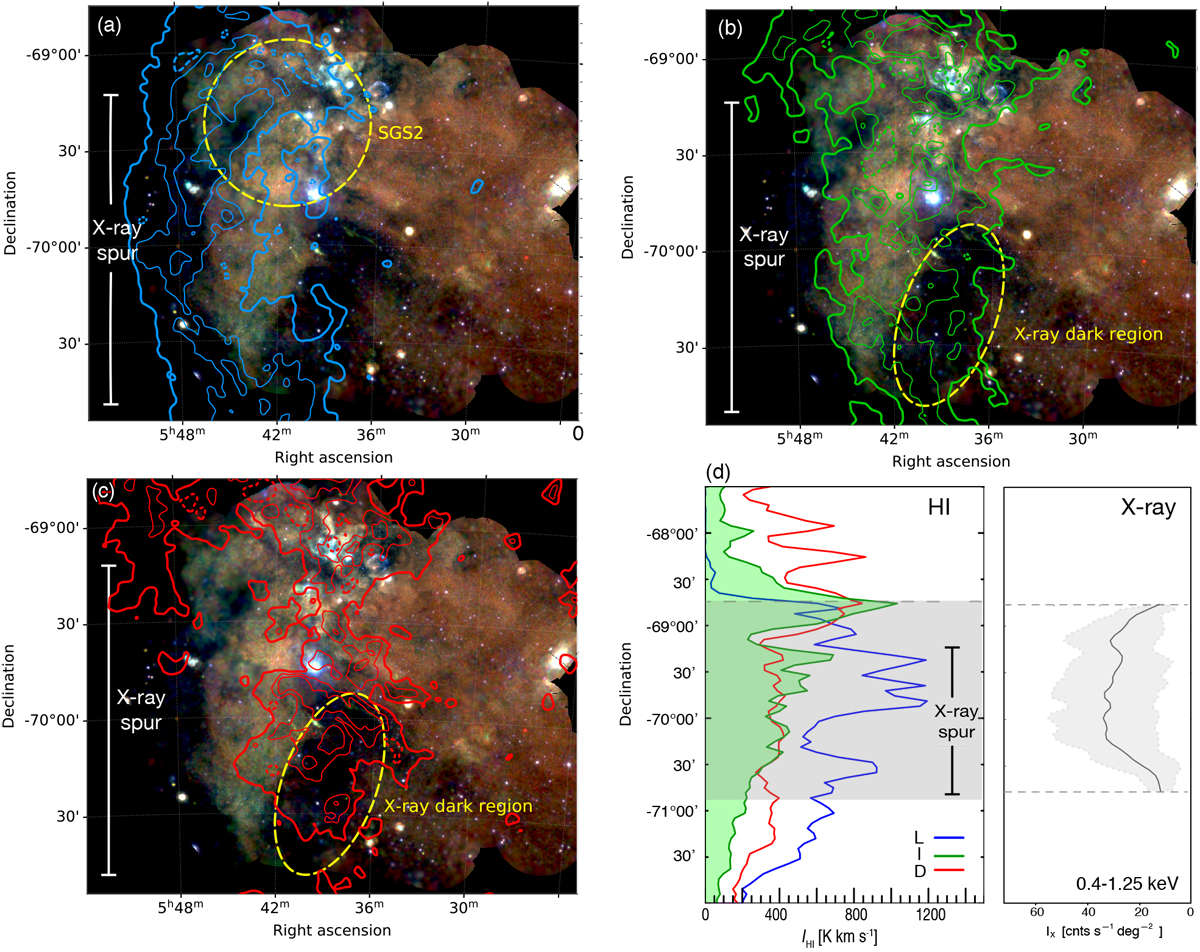
Composite of the XMM-Newton three-color mosaic and H I contours. The X-ray colors correspond to 0.4–0.7 keV (red), 0.7–1.0 keV (green) and 1.0–1.25 keV (blue). The L-component contours are shown in (a) in cyan, the I-component (b) in green and the D-component in red (c). The contours were generated from the 80 − 99 percentile range of the corresponding emission strength with linear scaling (L-component: 293–1441 K km s−1; I-component: 458–1406 K km s−1; D-component: 669–1359 K km s−1). The lowest level is indicated with thick lines. The LMC-SGS 2 and X-ray dark region are marked with dashed regions. Intensity profiles are shown in (d) which were integrated in Right ascension from RA = 5h49m to 5h 40m. Left panel: H I component intensities and right panel: X-ray intensity in the 0.4–1.25 keV range. A detailed description how the brightness profiles were derived is given in Sect. 4.1.1.
Current usage metrics show cumulative count of Article Views (full-text article views including HTML views, PDF and ePub downloads, according to the available data) and Abstracts Views on Vision4Press platform.
Data correspond to usage on the plateform after 2015. The current usage metrics is available 48-96 hours after online publication and is updated daily on week days.
Initial download of the metrics may take a while.