Fig. 8
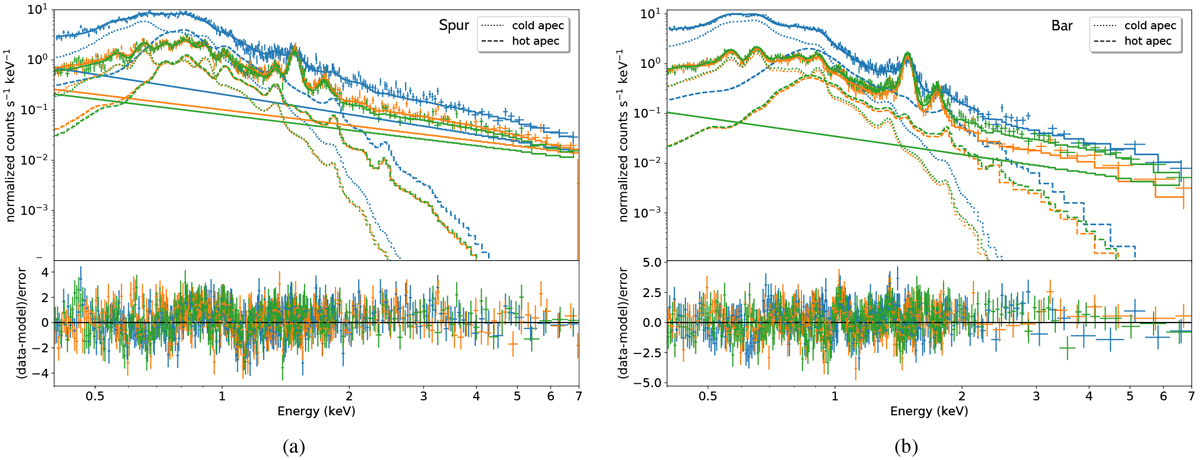
Spectra of the “Spur Central” region in the X-ray spur shown in (a) and for the “Soft West” region outside of the X-ray spur and 30 Dor in (b). The pn spectrum and model are shown in blue, while the MOS1 and MOS2 models and spectra are shown in green and yellow, respectively. The diffuse plasma model components are indicated with thick dashed and dotted lines in the corresponding detector color (see legend). The lower panel shows the residuals between model and data. The background was not subtracted but modeled simultaneously (see text). For better presentation, the data were rebinned visually with either 50 counts or 5σ.
Current usage metrics show cumulative count of Article Views (full-text article views including HTML views, PDF and ePub downloads, according to the available data) and Abstracts Views on Vision4Press platform.
Data correspond to usage on the plateform after 2015. The current usage metrics is available 48-96 hours after online publication and is updated daily on week days.
Initial download of the metrics may take a while.