Fig. 9.
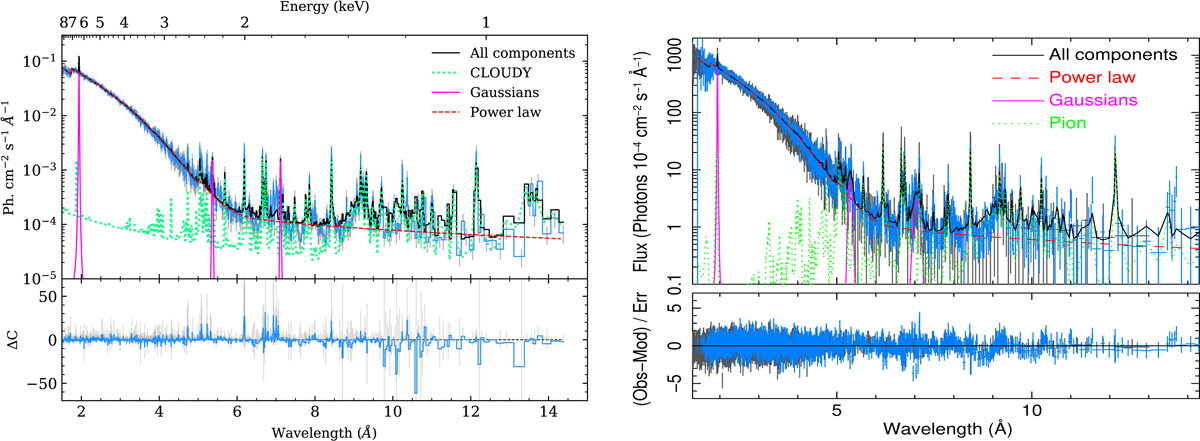
Fit of the whole spectrum with the photoionisation model (dotted green line) from CLOUDY (left panel) and SPEX (right panel), plus a partially covered power law (dotted red line), and three Gaussians for the fluorescence lines of Fe Kα, S II-VIII, and Si II-VI (solid magenta lines). The total fit function is represented in black. The residuals of fit are in the bottom panels. Spectra were re-binned for the sake of clarity.
Current usage metrics show cumulative count of Article Views (full-text article views including HTML views, PDF and ePub downloads, according to the available data) and Abstracts Views on Vision4Press platform.
Data correspond to usage on the plateform after 2015. The current usage metrics is available 48-96 hours after online publication and is updated daily on week days.
Initial download of the metrics may take a while.