Fig. C.2
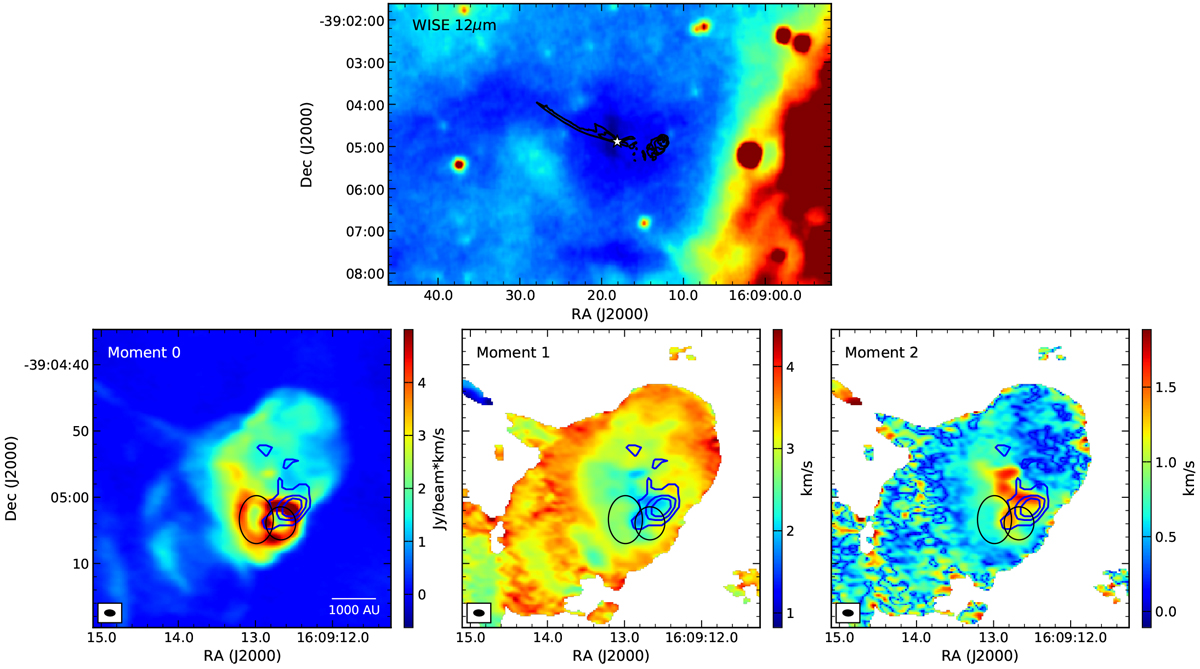
IRAS 16059-3857. Up: 12 μm WISE emission. The star symbol indicates the position of the compact source associated with IRAS 16059-3857. The black contours shows the outflow emission. Bottom: moment maps of the shell-shape structures detected in the blue lobe. Black ellipses show the structures detected from the moment 0 map. Blue contours show the dss2 emission associated with HH 78.
Current usage metrics show cumulative count of Article Views (full-text article views including HTML views, PDF and ePub downloads, according to the available data) and Abstracts Views on Vision4Press platform.
Data correspond to usage on the plateform after 2015. The current usage metrics is available 48-96 hours after online publication and is updated daily on week days.
Initial download of the metrics may take a while.