Fig. 2
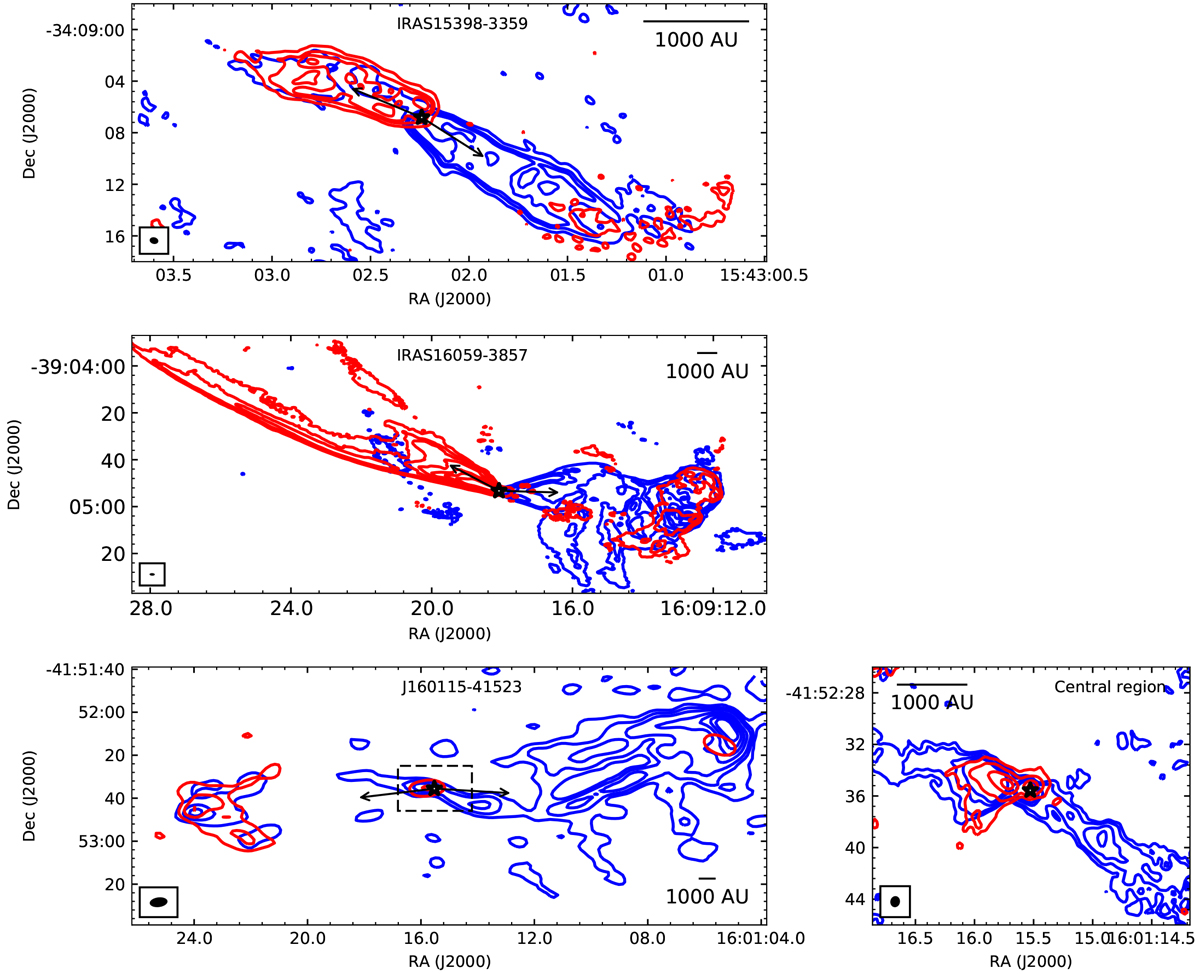
12CO(2–1) integrated intensity images showing the blue-shifted and red-shifted emission for the outflows associated with IRAS15398-3359 (top panel, 12m+7m data), IRAS 16059-3857 (middle panel, 12m+7m data), and J160115-41523 (bottom panels, 7m data at left and 12m data at right). Each panel is labeled with the name of the source. The minimum and maximum velocities over which the emission is integrated are chosen based on visual inspection of the velocity channels (Table 8). Left panels: contours correspond to 10, 20, and 40 times the rms noise level (the rms noise for the full outflow moment 0 blue and red maps are 0.03–0.04, 0.04–0.05, and 0.2–0.08 Jy beam−1 km s−1 for IRAS 15398-3359, IRAS 16059-3857, and J160115-41523, respectively). Bottom right panel: 12CO high-angular resolutionintegrated intensity emission of the blue- and red-shifted lobes toward the central region of J160115-41523, indicated with a box in the bottom left panel. The contours correspond to 3, 5, and 7 times the rms noise levels (rms of the blue and red maps are 0.04 and 0.1 Jy beam−1 km s−1, respectively). The locations of the driving sources match the corresponding millimeter continuum emission, and are marked with black stars in the images. The estimated PA of each outflow lobe is indicated by black arrows. The beam sizes are shown as black ellipses in the lower left of each panel.
Current usage metrics show cumulative count of Article Views (full-text article views including HTML views, PDF and ePub downloads, according to the available data) and Abstracts Views on Vision4Press platform.
Data correspond to usage on the plateform after 2015. The current usage metrics is available 48-96 hours after online publication and is updated daily on week days.
Initial download of the metrics may take a while.