Fig. A.1
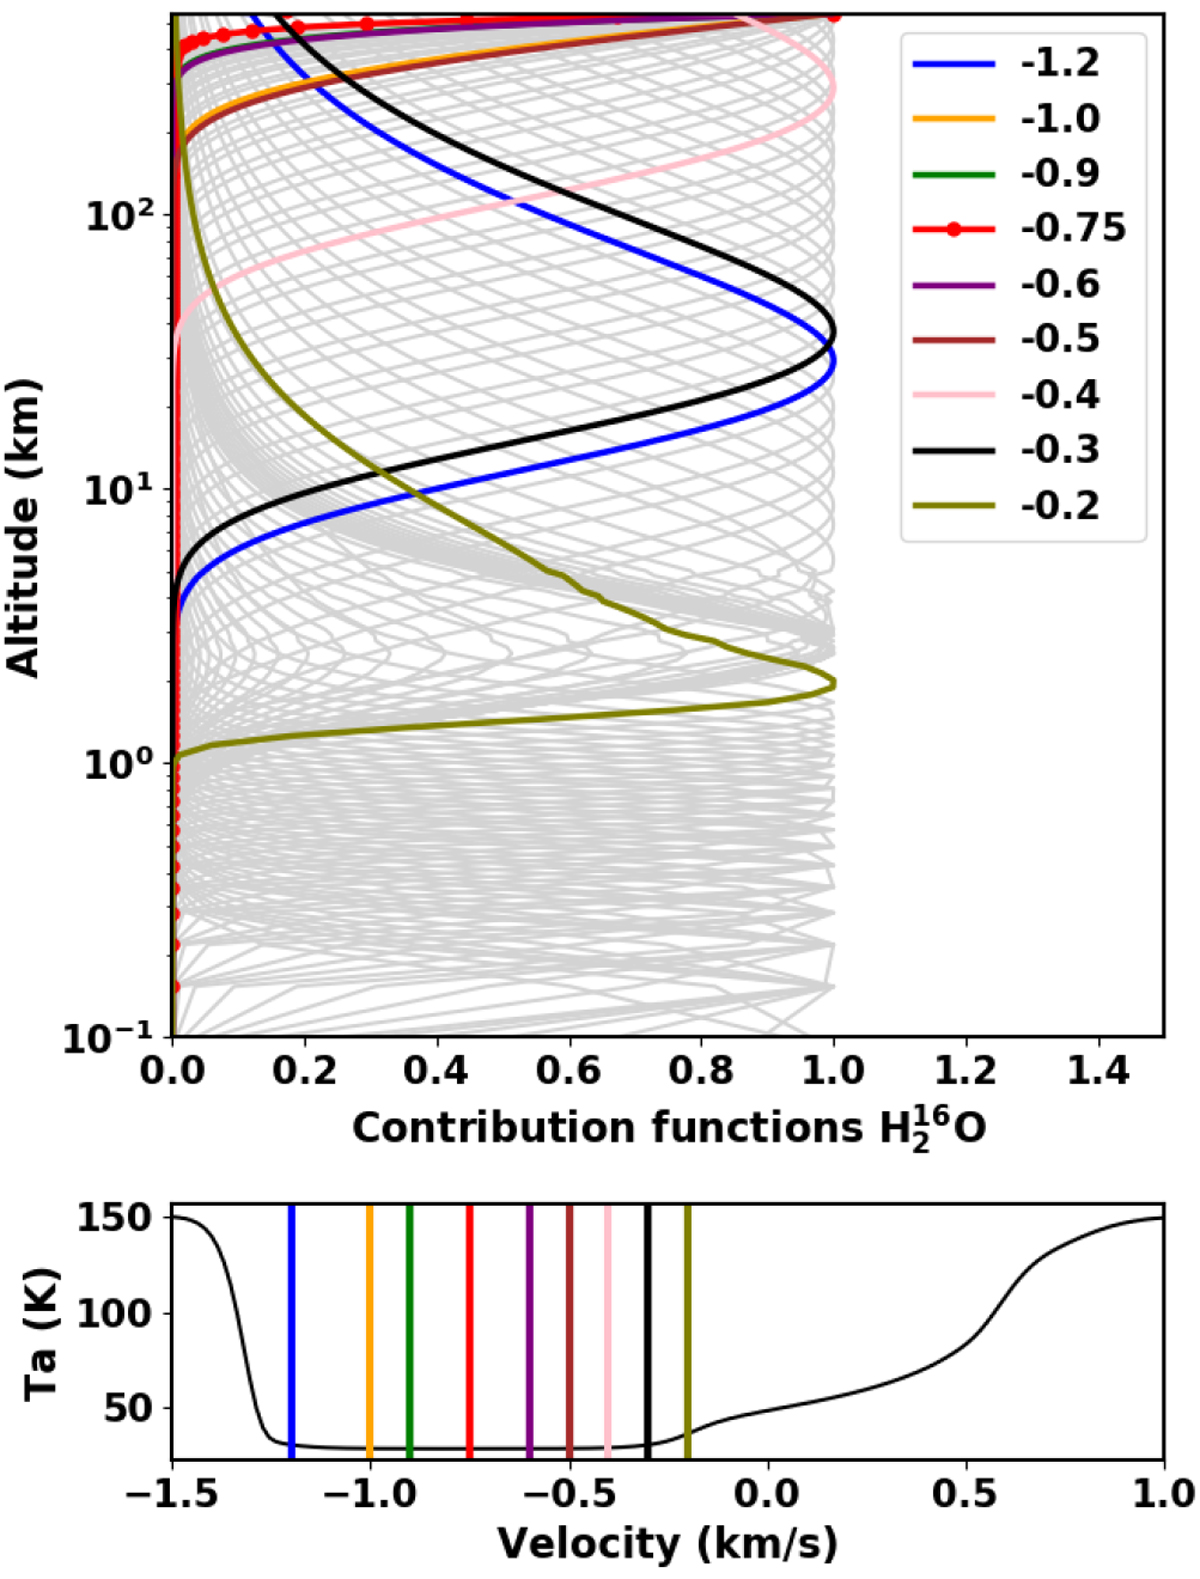
Top: contribution functions for H![]() O transition at 557 GHz normalized to the maximum value to clearly indicate the peak altitude at each velocity/frequency point. These were calculated for an optically thick case of water column density 5 × 10¹⁶
cm−2. The terminal velocity in the input atmosphere for these calculations is set to −0.75 km s−1
and is reached at about 3.5 km from surface. The other color lines correspond to different velocity offsets for comparison, and correspond to the vertical lines in the bottom panel. The rest of the velocities are shown in gray lines. Bottom: synthetic spectra line are shown for reference. The vertical lines depict locations in velocity space corresponding to the contributionfunctions shown in the top panel.
O transition at 557 GHz normalized to the maximum value to clearly indicate the peak altitude at each velocity/frequency point. These were calculated for an optically thick case of water column density 5 × 10¹⁶
cm−2. The terminal velocity in the input atmosphere for these calculations is set to −0.75 km s−1
and is reached at about 3.5 km from surface. The other color lines correspond to different velocity offsets for comparison, and correspond to the vertical lines in the bottom panel. The rest of the velocities are shown in gray lines. Bottom: synthetic spectra line are shown for reference. The vertical lines depict locations in velocity space corresponding to the contributionfunctions shown in the top panel.
Current usage metrics show cumulative count of Article Views (full-text article views including HTML views, PDF and ePub downloads, according to the available data) and Abstracts Views on Vision4Press platform.
Data correspond to usage on the plateform after 2015. The current usage metrics is available 48-96 hours after online publication and is updated daily on week days.
Initial download of the metrics may take a while.