Fig. 3.
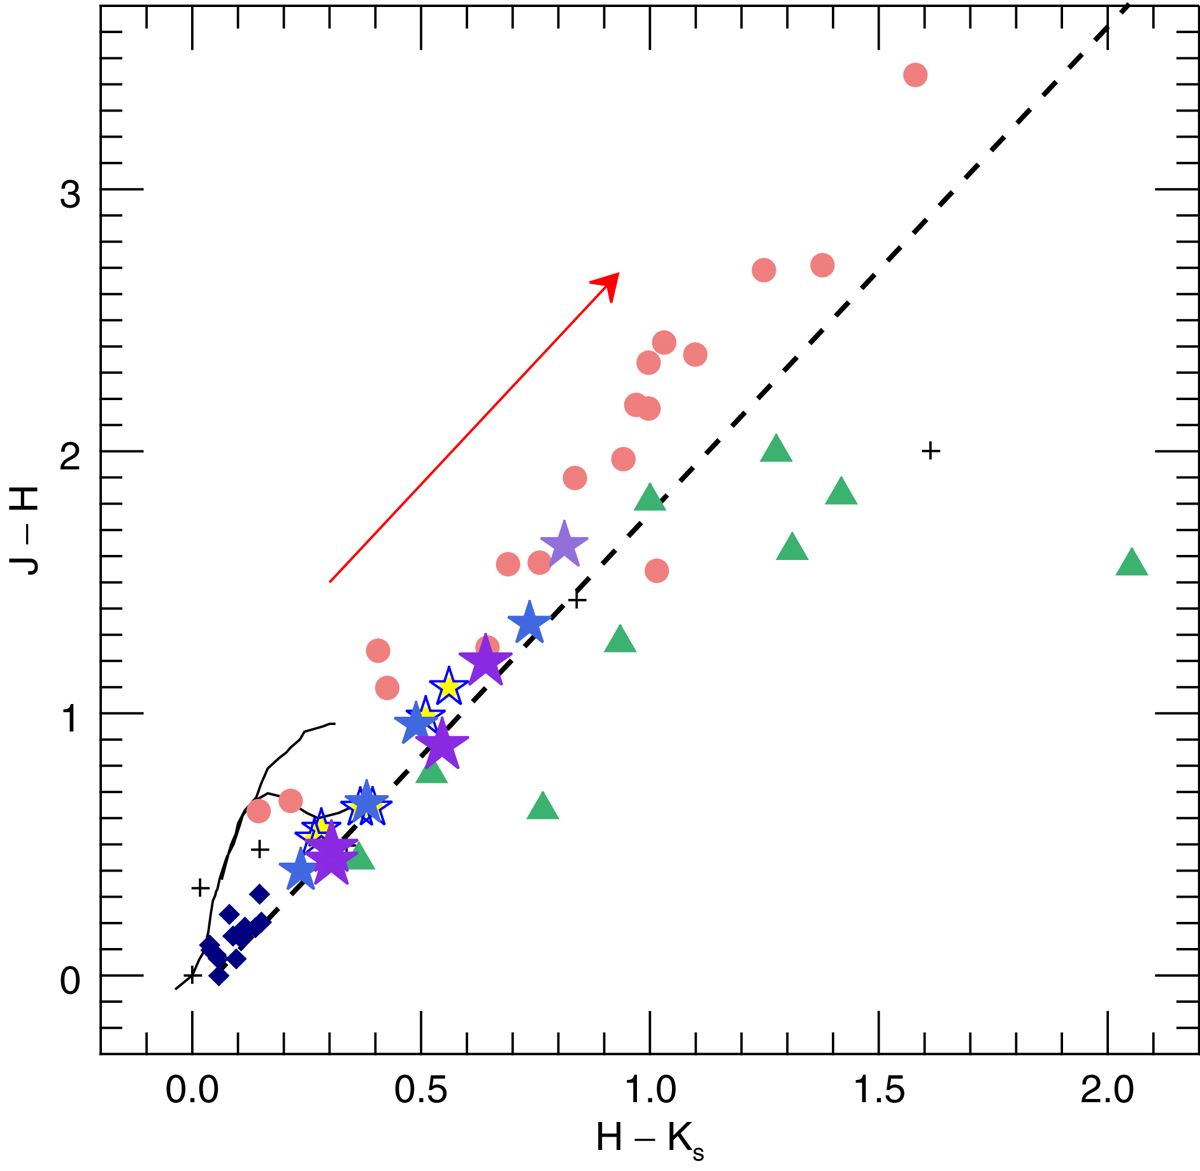
Near-infrared color-color diagram of the KMOS target stars. The solid lines show the color of the main-sequence and giant stars, the arrow shows an AV = 10 mag reddening vector with slope 1.85 (see Zeidler et al. 2016), and the thick dashed line marks the separation between the photospheric reddening band (above this line) and the infrared excess region (below this line). Symbols and colors for the stars are the same as in Fig. 2.
Current usage metrics show cumulative count of Article Views (full-text article views including HTML views, PDF and ePub downloads, according to the available data) and Abstracts Views on Vision4Press platform.
Data correspond to usage on the plateform after 2015. The current usage metrics is available 48-96 hours after online publication and is updated daily on week days.
Initial download of the metrics may take a while.