Fig. 1
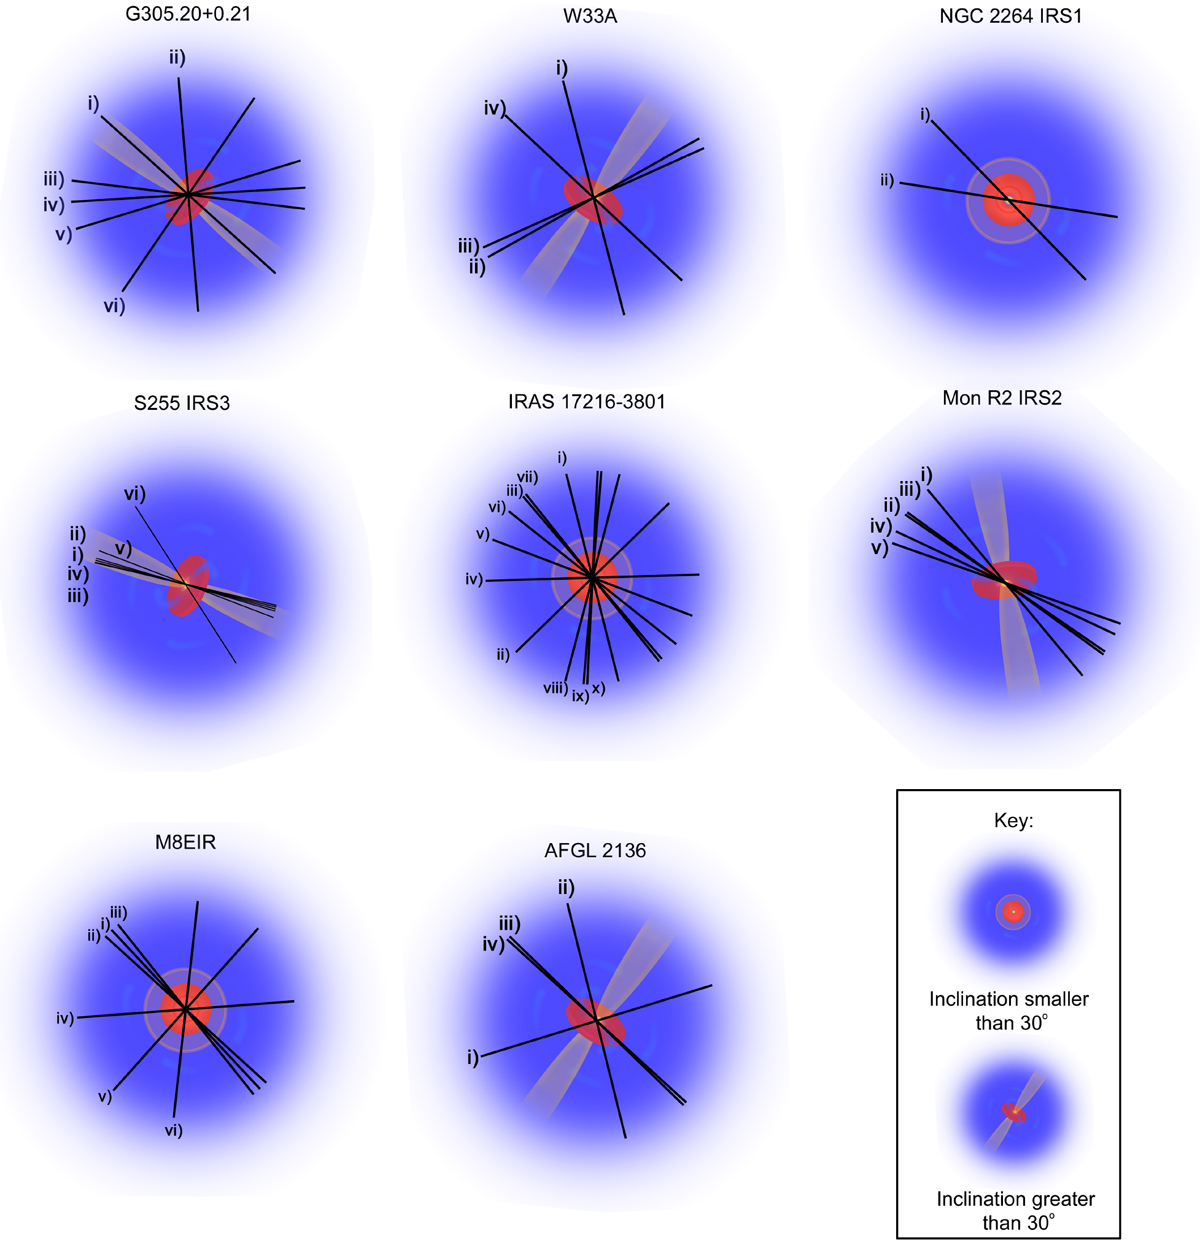
Schematics of the suspected geometries of each of the sources with the position angles of each configuration of their MIDI data additionally shown. G305.20+0.21, the subject of Paper I, is also shown. The envelope is shown in blue, the cavity in yellow and the disk in red. Two different schematics are shown, one that applies to sources that have inclinations of less than 30 degrees. In this case, most of the cavity emission will be along the same region of the disk in the line of sight. The other schematic represents sources inclined to the point where cavity emission extends beyond the disk in the line of sight.
Current usage metrics show cumulative count of Article Views (full-text article views including HTML views, PDF and ePub downloads, according to the available data) and Abstracts Views on Vision4Press platform.
Data correspond to usage on the plateform after 2015. The current usage metrics is available 48-96 hours after online publication and is updated daily on week days.
Initial download of the metrics may take a while.