Fig. A.19
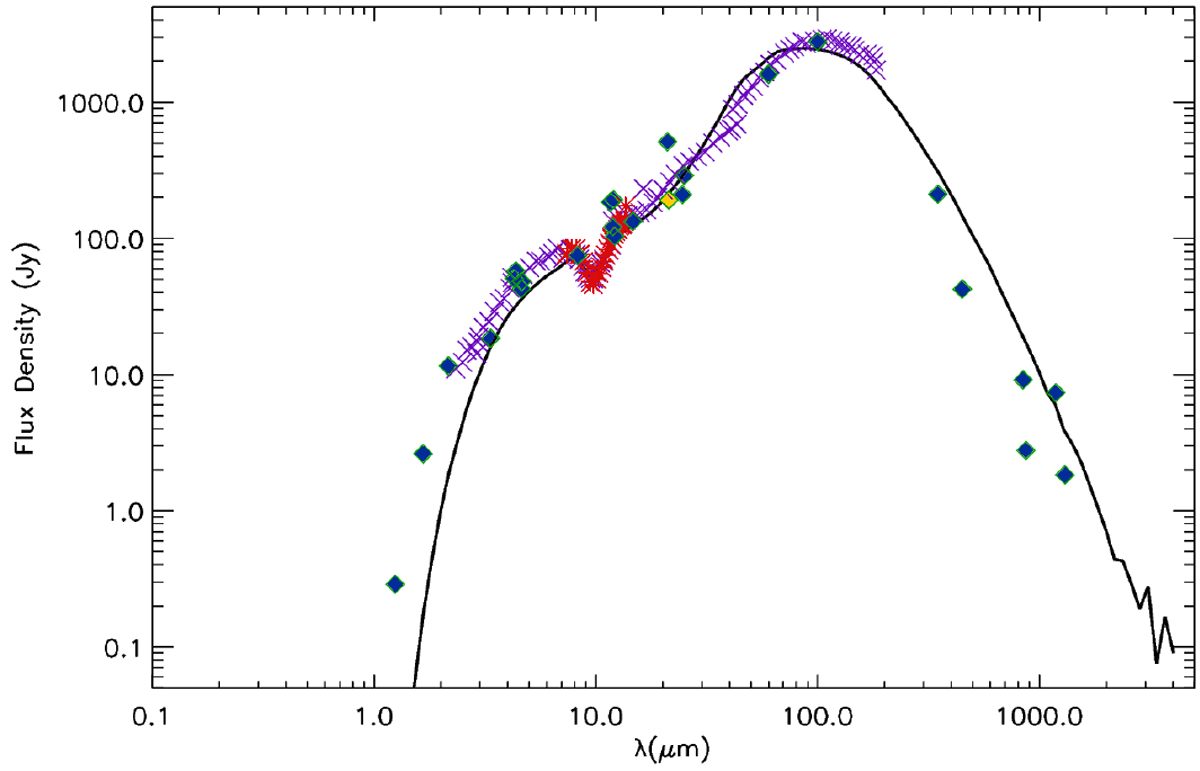
Model SED of the best-fitting model (black) for M8EIR. All fluxes from the literature are shown as diamonds, except for the spectrum from Feldt et al. (2008). This was sampled electronically and the data are represented as purple crosses. Thefluxes corresponding to the MIDI visibilities are shown in red. Open symbols correspond to upper limits.
Current usage metrics show cumulative count of Article Views (full-text article views including HTML views, PDF and ePub downloads, according to the available data) and Abstracts Views on Vision4Press platform.
Data correspond to usage on the plateform after 2015. The current usage metrics is available 48-96 hours after online publication and is updated daily on week days.
Initial download of the metrics may take a while.