Free Access
Fig. A.3
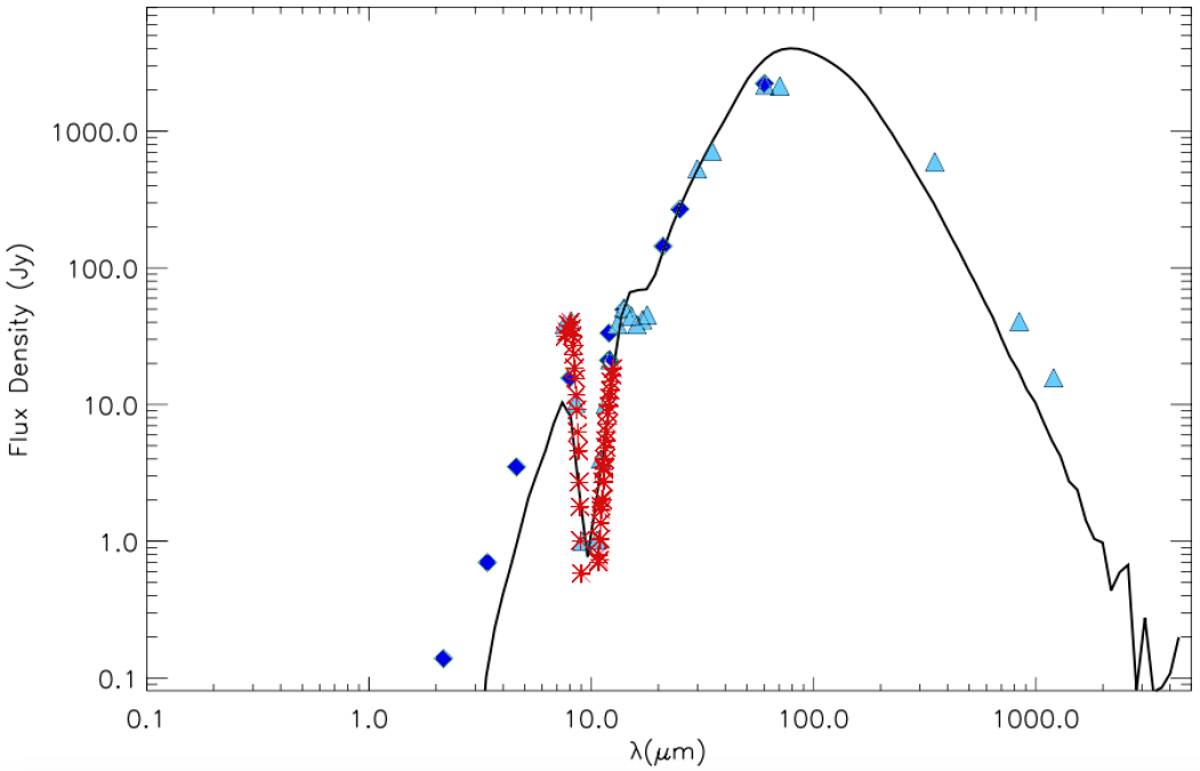
SED of the preferred final model for W33A. Data from the RMS survey are shown as diamonds, the MIDI spectrum is shown as red crosses and data points from de Wit et al. (2010) are shown as triangles.
Current usage metrics show cumulative count of Article Views (full-text article views including HTML views, PDF and ePub downloads, according to the available data) and Abstracts Views on Vision4Press platform.
Data correspond to usage on the plateform after 2015. The current usage metrics is available 48-96 hours after online publication and is updated daily on week days.
Initial download of the metrics may take a while.