Fig. 10
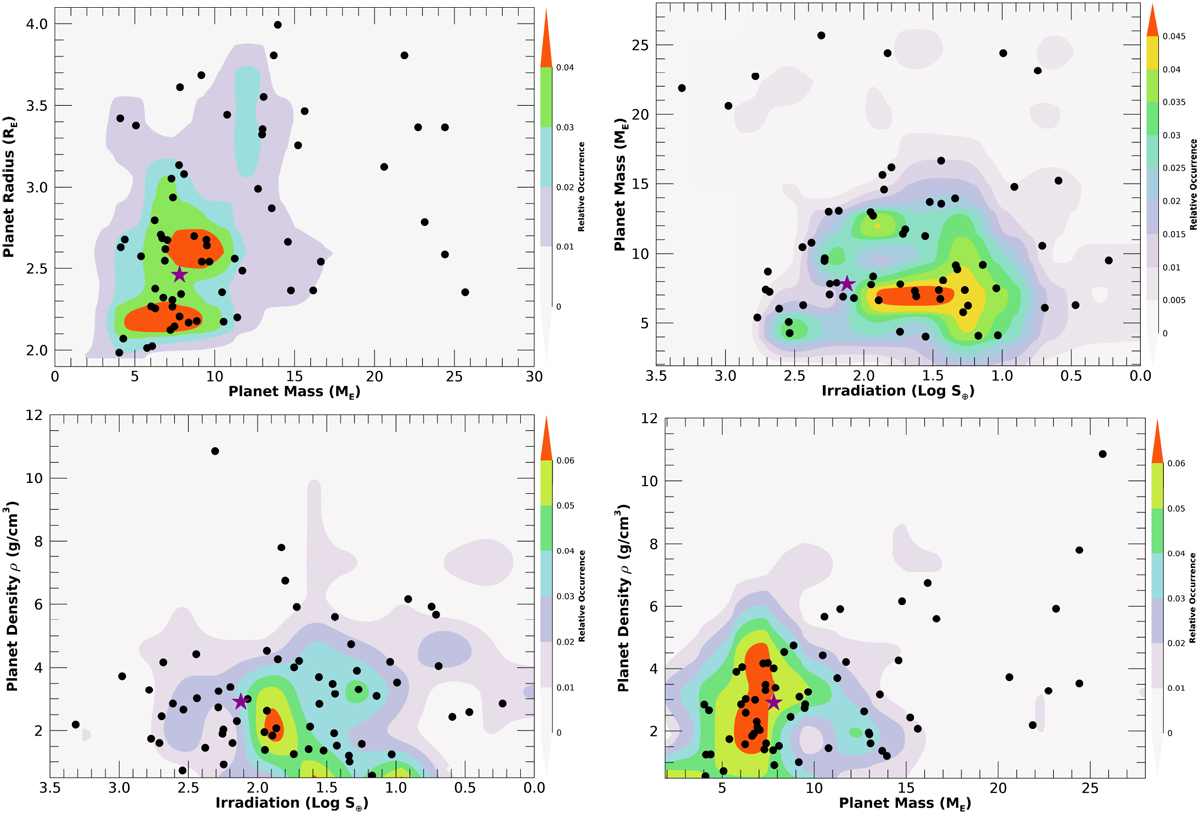
Top left: mass-radius diagram with contours built using the exoplanets sample from Fig. 8. Black dots represent planets with mass measurements at the > 3σ level of statistical significance. HD 5278 b is indicated by a large dark magenta star. The contours are color-coded in terms of relative occurrence. Top right: same plot in the planetary mass–stellar irradiation plane. Bottom left: same plot in the planetary density vs. stellar irradiation plane. Bottom right: same plot in the planetary density vs. mass plane.
Current usage metrics show cumulative count of Article Views (full-text article views including HTML views, PDF and ePub downloads, according to the available data) and Abstracts Views on Vision4Press platform.
Data correspond to usage on the plateform after 2015. The current usage metrics is available 48-96 hours after online publication and is updated daily on week days.
Initial download of the metrics may take a while.