Free Access
Fig. B.3.
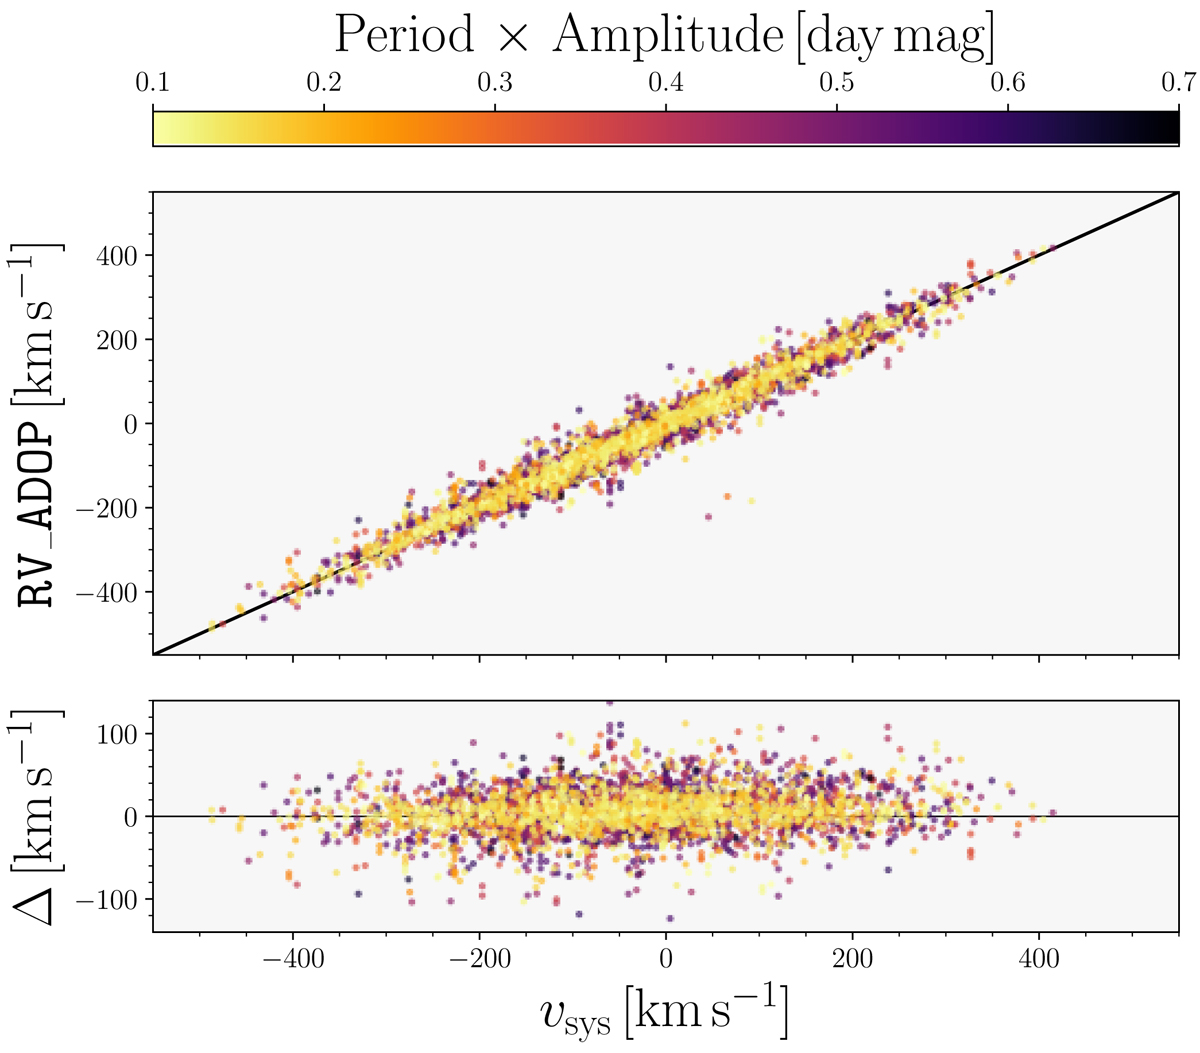
Comparison between line-of-sight velocities RV_ADOP derived by SSPP and our systemic velocities calculated using the line-of-sight velocity templates (top panel) and the residuals of their difference (bottom panel) with a color coding that is based on the product of pulsation period and amplitude.
Current usage metrics show cumulative count of Article Views (full-text article views including HTML views, PDF and ePub downloads, according to the available data) and Abstracts Views on Vision4Press platform.
Data correspond to usage on the plateform after 2015. The current usage metrics is available 48-96 hours after online publication and is updated daily on week days.
Initial download of the metrics may take a while.