Fig. C.1.
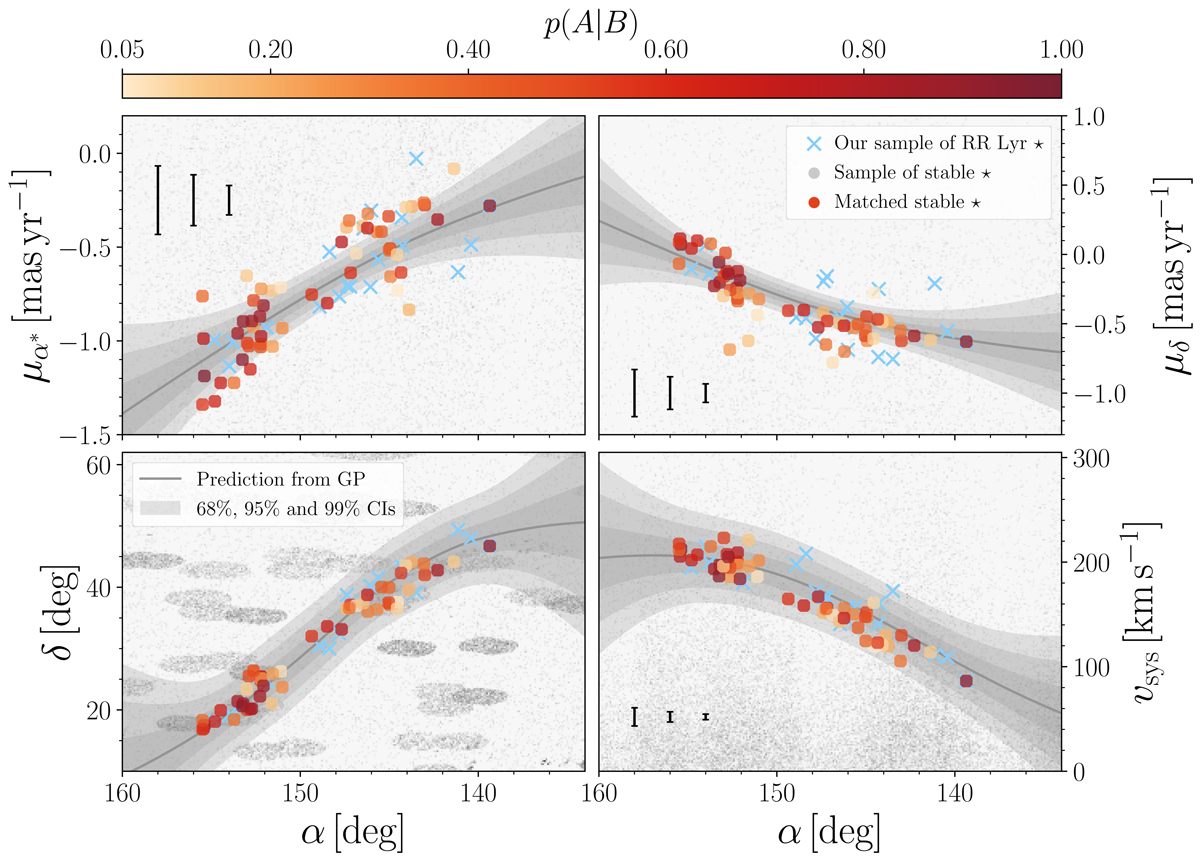
Four-parameter association of nonvariable stars with our identified sample of RR Lyrae variables (blue crosses) in the Orphan stellar stream. Similar to Fig. 3, the color coding denotes the membership probabilities p(A|B) in coordinate (bottom left panel), proper motion (upper panels), and systemic velocity (bottom right panel) space. The gray lines and shading represent the Gaussian process regression and confidence intervals (CIs), respectively. The three error bars at the bottom of each panel denote the 15.9, 50, and 84.1 percentiles of the uncertainties on individual parameters.
Current usage metrics show cumulative count of Article Views (full-text article views including HTML views, PDF and ePub downloads, according to the available data) and Abstracts Views on Vision4Press platform.
Data correspond to usage on the plateform after 2015. The current usage metrics is available 48-96 hours after online publication and is updated daily on week days.
Initial download of the metrics may take a while.