Fig. 2.
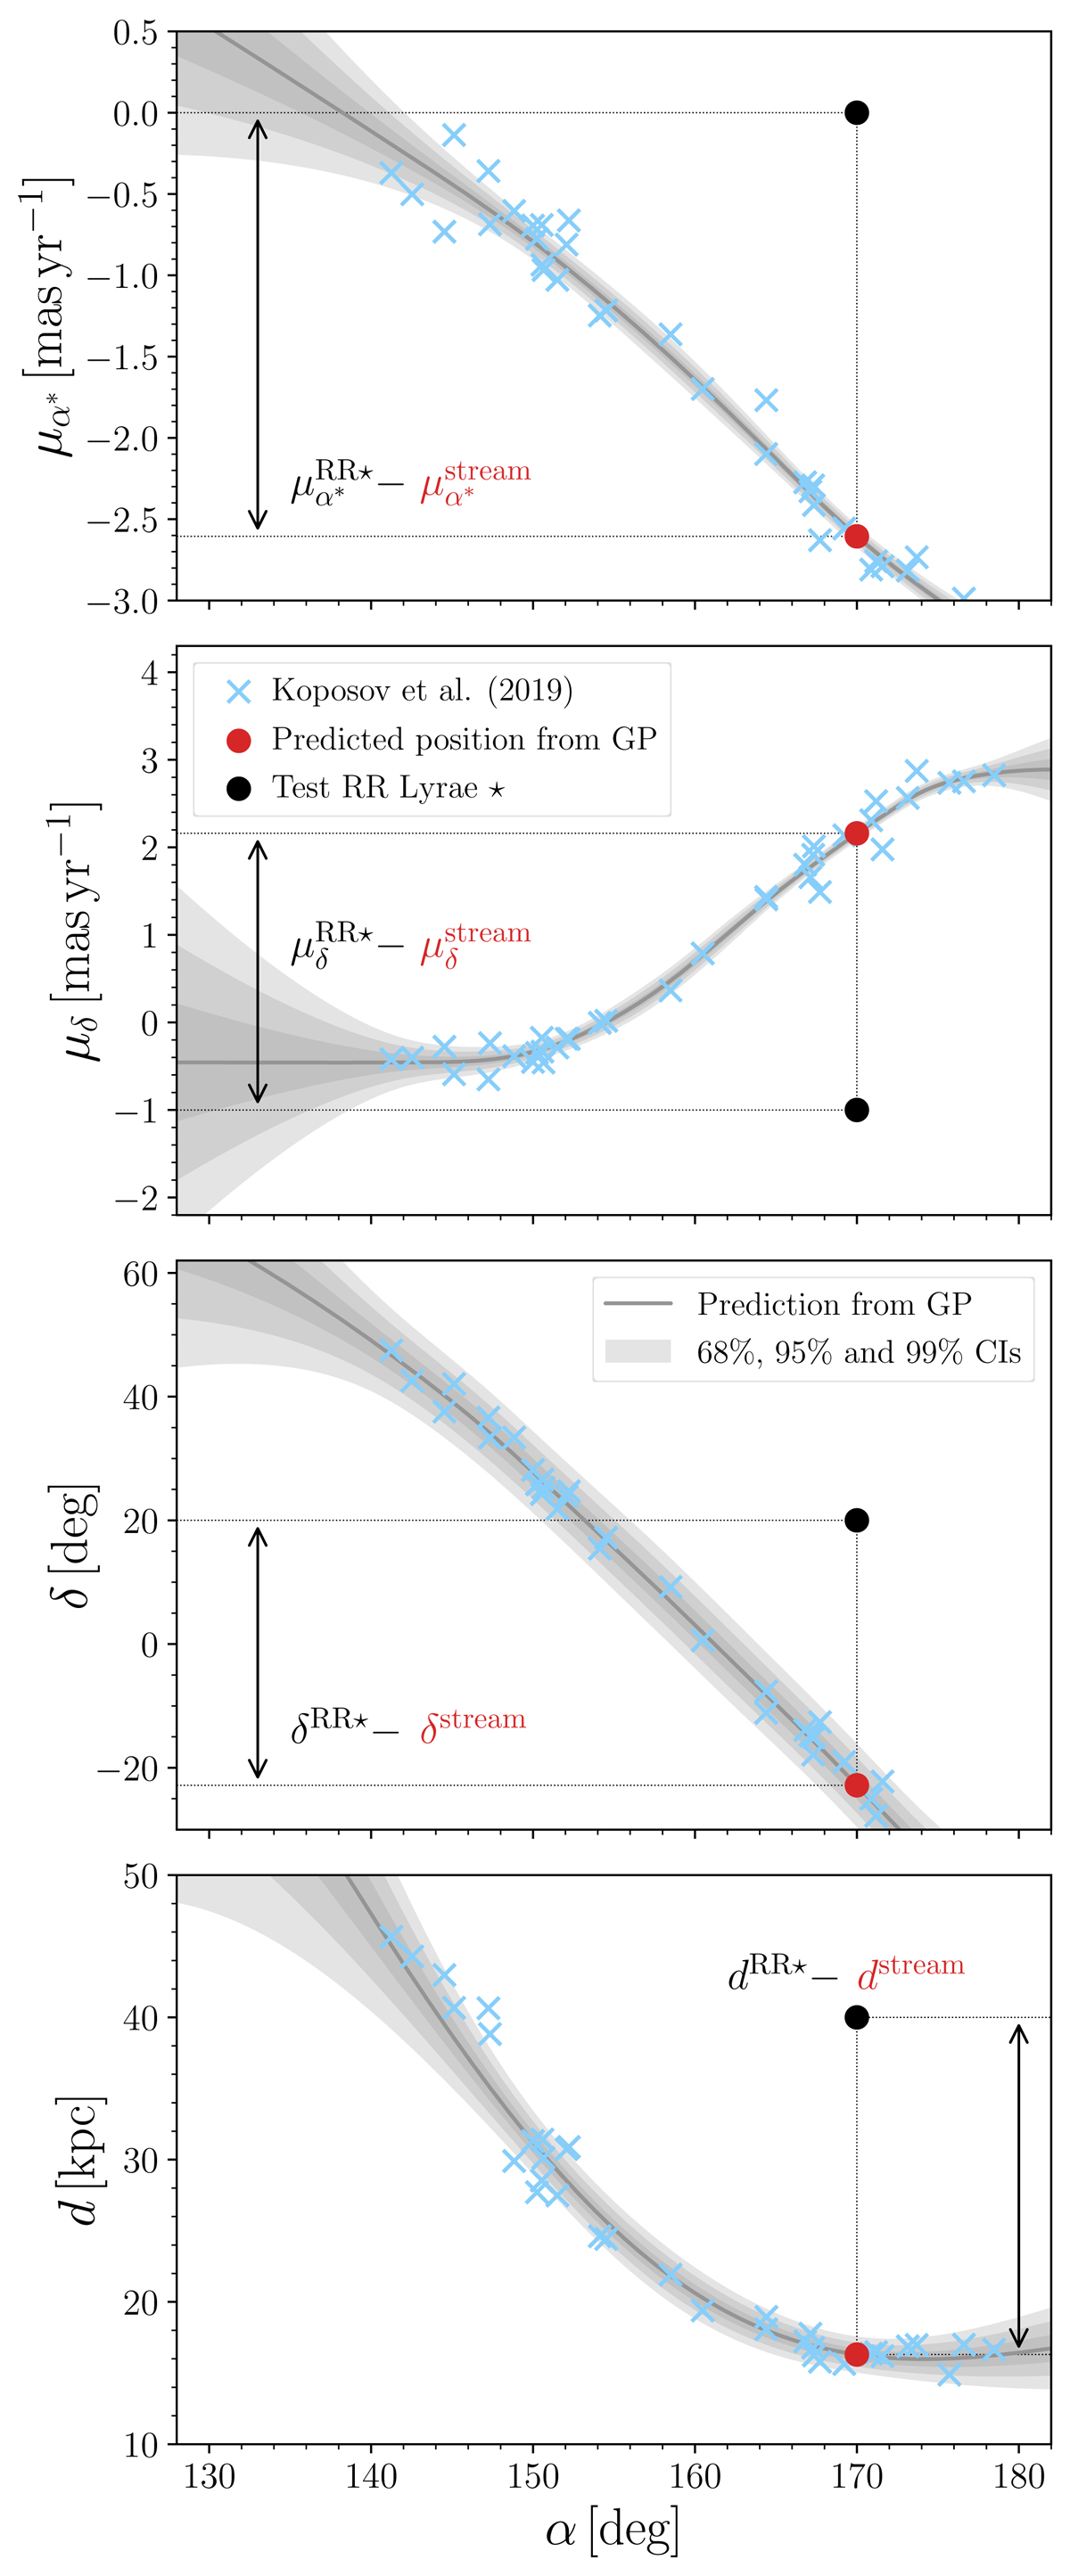
Visual example of the membership analysis for the Orphan stellar stream using data from Koposov et al. (2019) (blue crosses), with an artificially placed star (black dot), and its stream counterpart (red dot) at the same α and predicted values of δ, μα*, μδ, and d. Black solid lines and gray shaded regions denote the GP regression and its confidence intervals (CIs, ±1, 2, 3σ), respectively.
Current usage metrics show cumulative count of Article Views (full-text article views including HTML views, PDF and ePub downloads, according to the available data) and Abstracts Views on Vision4Press platform.
Data correspond to usage on the plateform after 2015. The current usage metrics is available 48-96 hours after online publication and is updated daily on week days.
Initial download of the metrics may take a while.