Fig. 4.
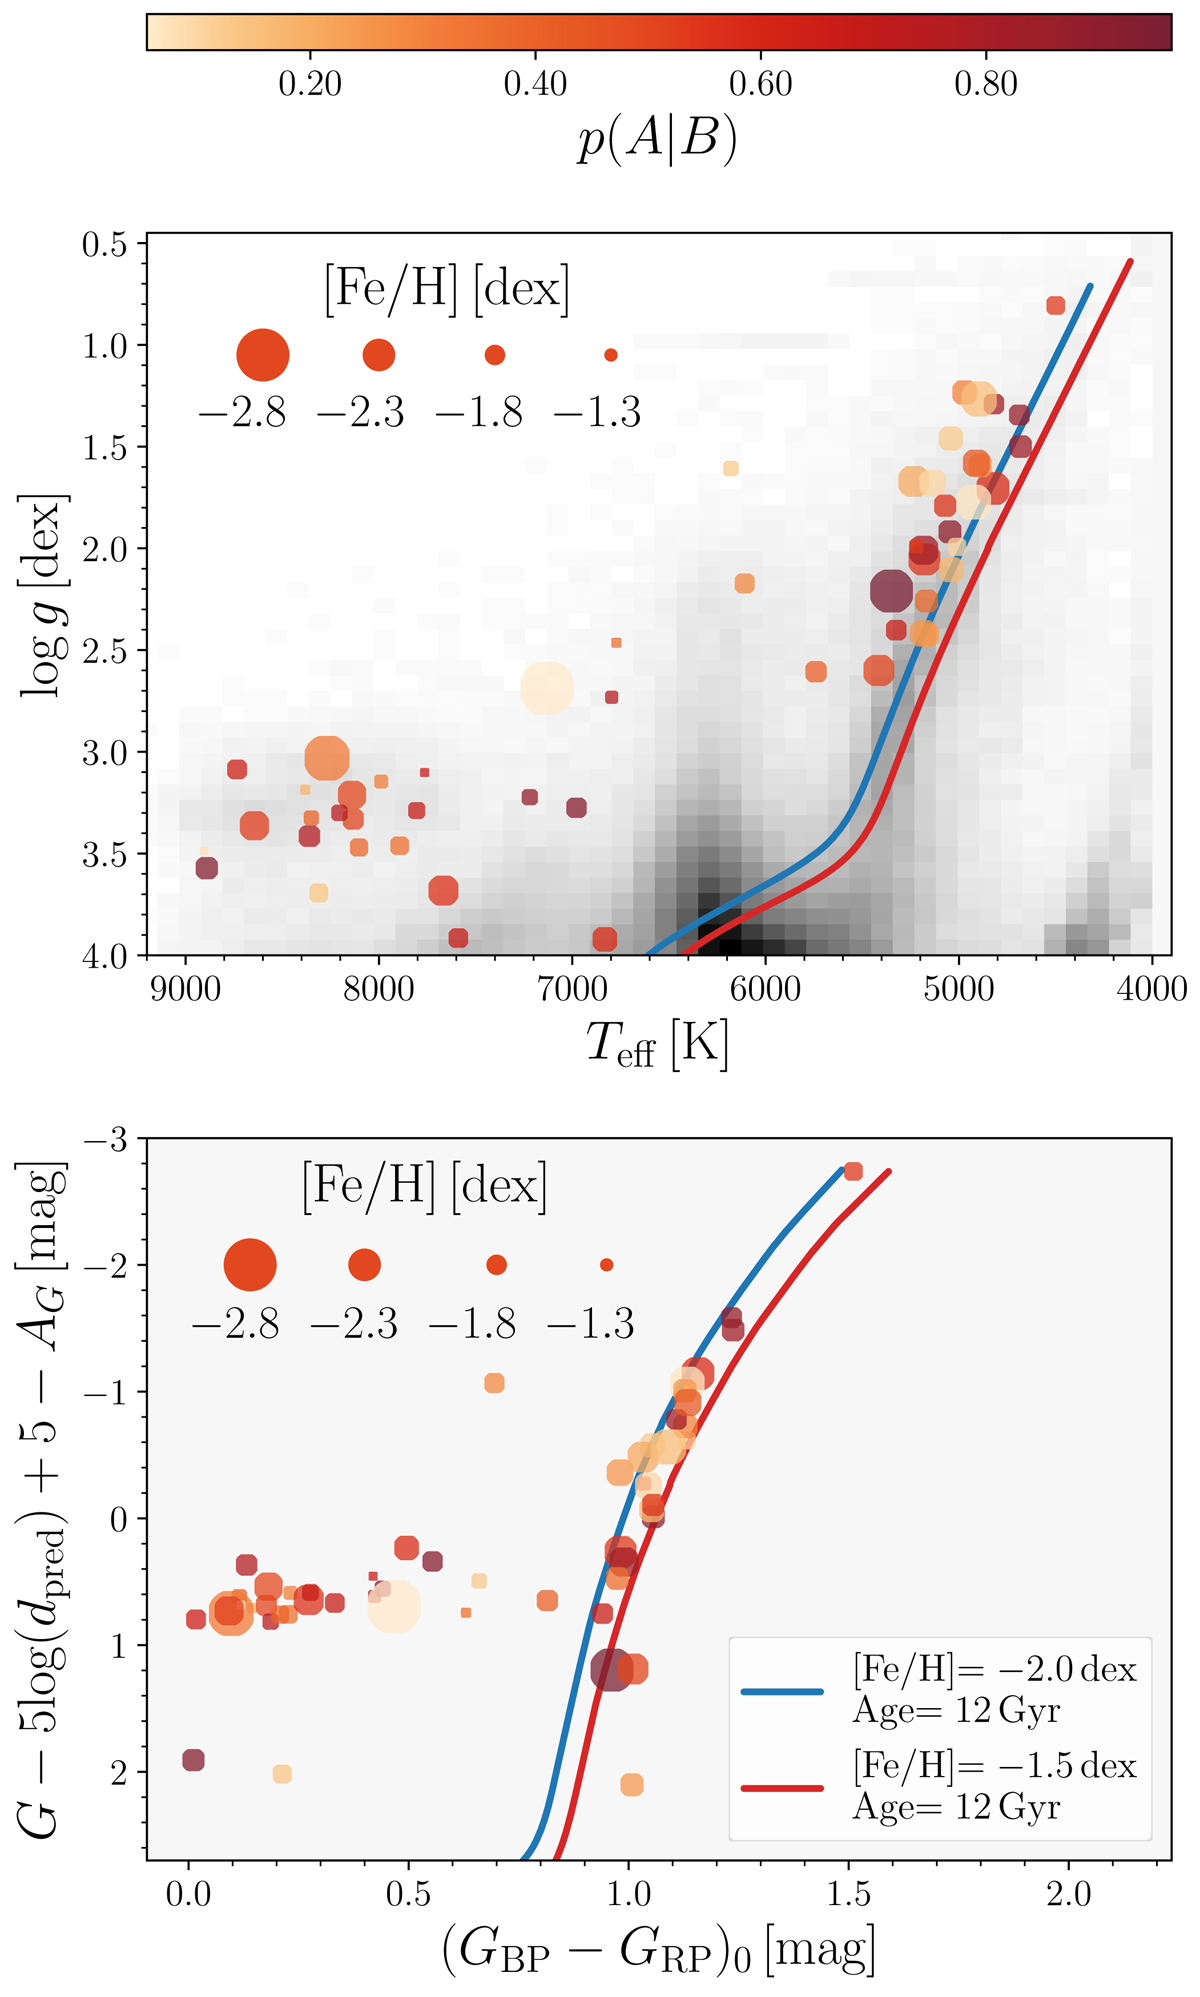
Kiel diagram (top panel, using quantities from the SSPP pipeline), and the color-magnitude diagram (bottom panel) for stars likely associated with the Orphan stellar stream color-coded based on the probability and with varying point size denoting the metallicity. The blue and red lines represent isochrones from the MESA Isochrones and Stellar Tracks (MIST, Dotter 2016; Choi et al. 2016; Paxton et al. 2011, 2013, 2015) database for two different metallicities. The gray contours in the top panel represent the entire star matched sample of SDSS-Gaia.
Current usage metrics show cumulative count of Article Views (full-text article views including HTML views, PDF and ePub downloads, according to the available data) and Abstracts Views on Vision4Press platform.
Data correspond to usage on the plateform after 2015. The current usage metrics is available 48-96 hours after online publication and is updated daily on week days.
Initial download of the metrics may take a while.