Fig. 5.
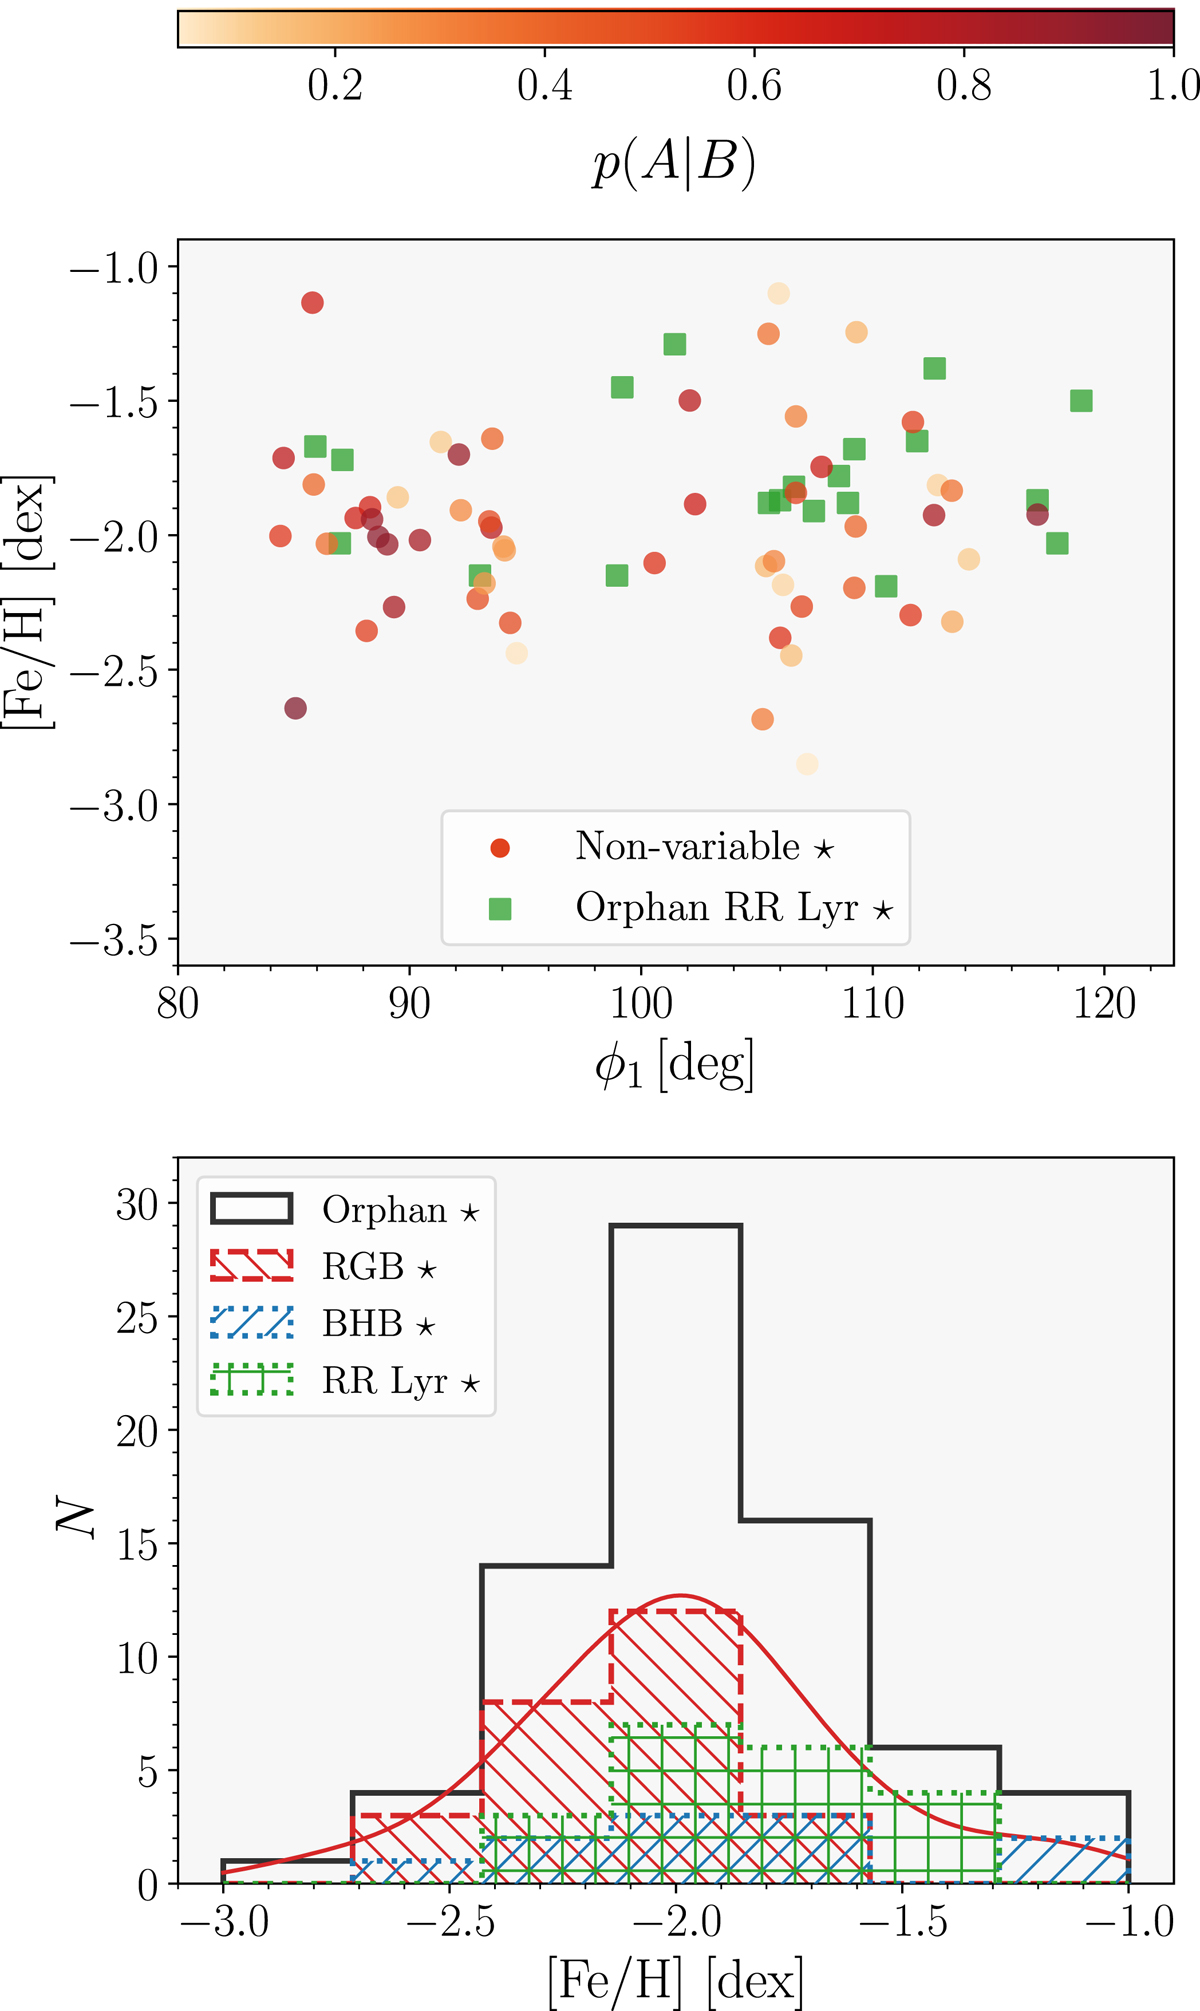
Stream coordinates, ϕ1, versus [Fe/H] (top panel), and metallicity distribution function (bottom panel) for likely variable andnonvariable Orphan stream members. The color-coding of each nonvariable star represents the probability of association to the Orphan stream p(A|B), and the green squares represent RR Lyrae stars associated with the Orphan stream in our study. The histogram in the lower panel represents the metallicity distribution of the entire sample (black line) the RGB stars (red dashed line), BHB stars (blue dotted line), and RR Lyrae stars (green lines). The red solid line represents the kernel density estimate of the metallicity distribution of the RGB stars.
Current usage metrics show cumulative count of Article Views (full-text article views including HTML views, PDF and ePub downloads, according to the available data) and Abstracts Views on Vision4Press platform.
Data correspond to usage on the plateform after 2015. The current usage metrics is available 48-96 hours after online publication and is updated daily on week days.
Initial download of the metrics may take a while.