Fig. 6.
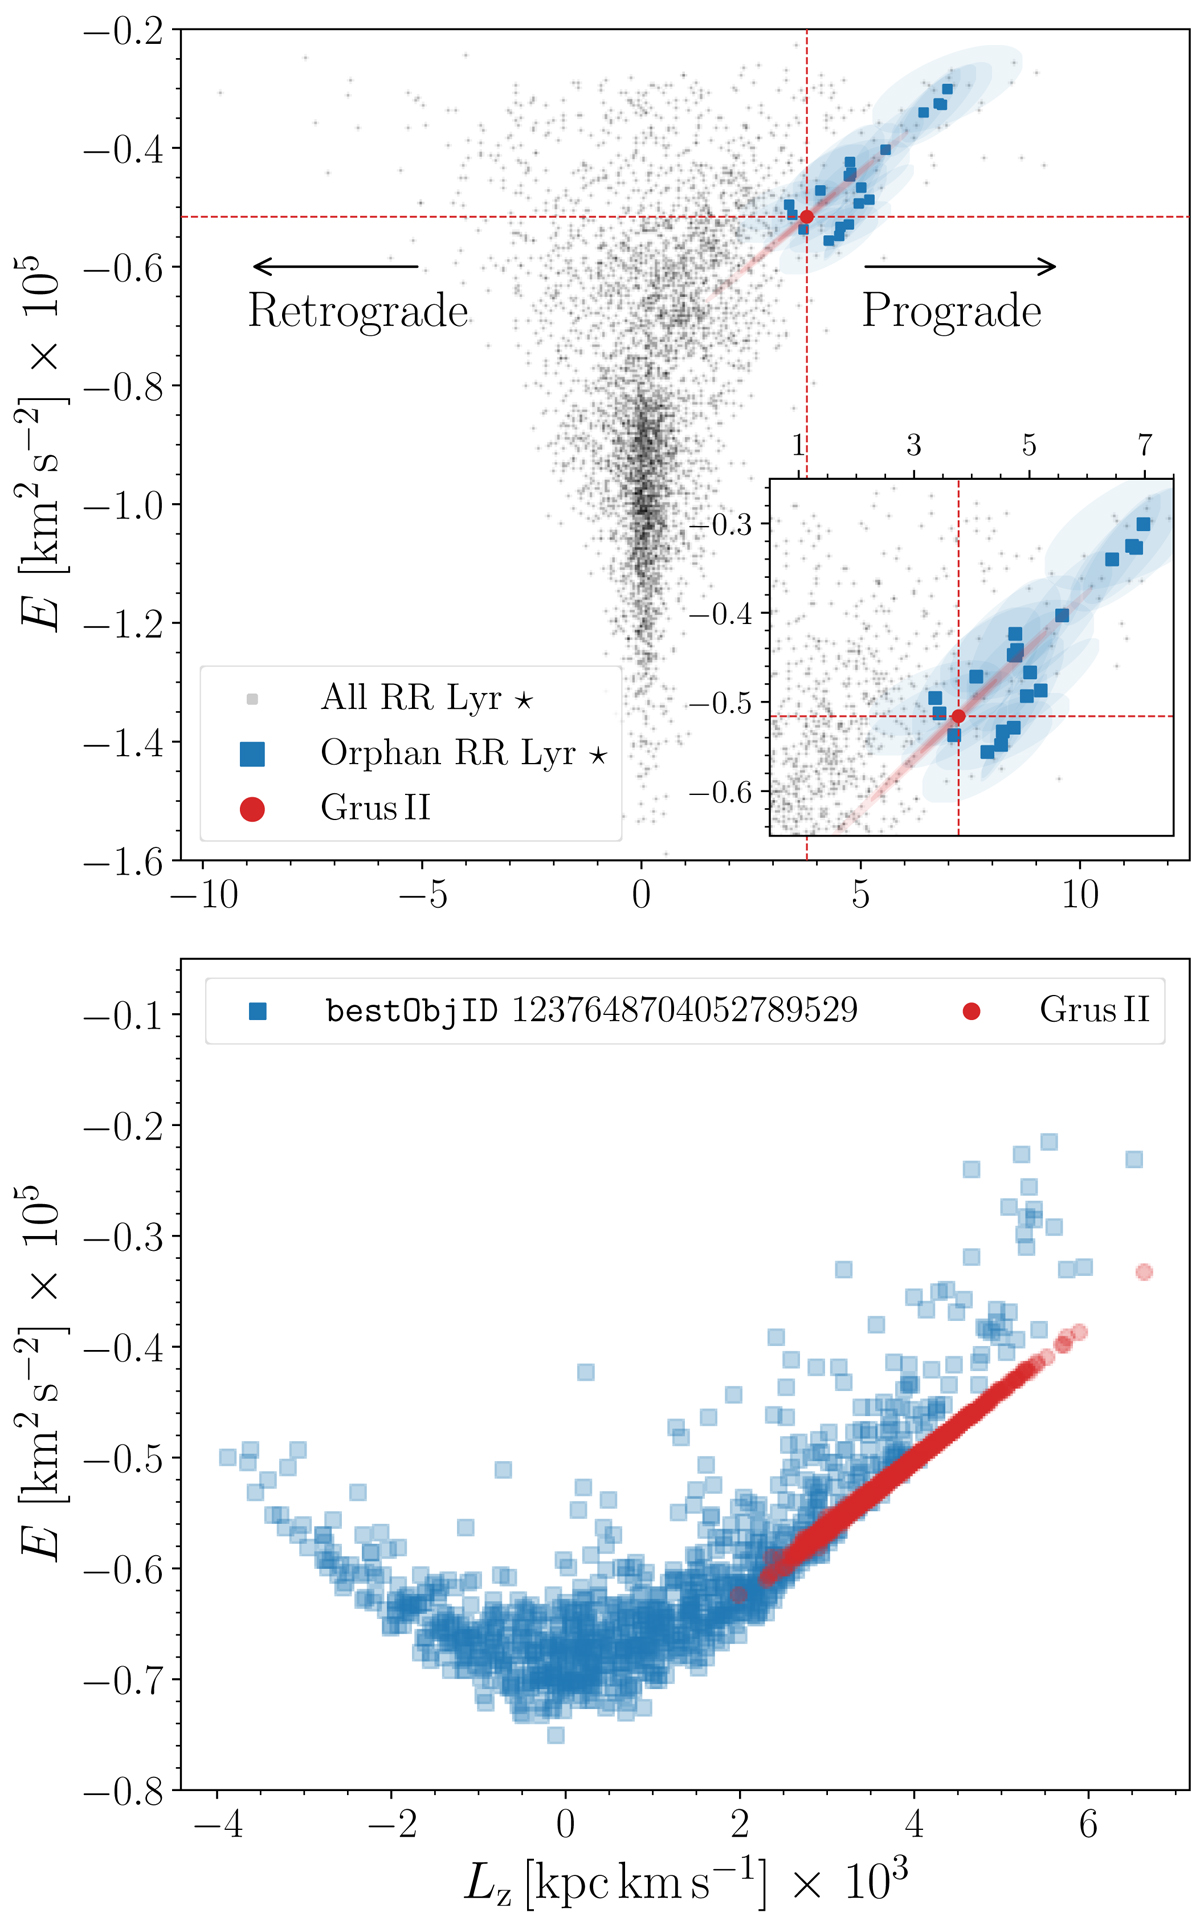
Distribution of the orbital energy E vs. the z-component of the angular momentum Lz (top panel). The bottom panel shows an example of the multivariate non-normal distribution of energies E vs. angular momenta for one of the stars from our sample (represented with blue squares) and Grus II (denoted with red circles). The underlying gray points in the upper panel represent the entire RR Lyrae sample fulfilling the condition in Eq. (1). The blue squares represent the RR Lyrae variables associated with the Orphan stellar stream. Each point is accompanied with an error ellipse estimated based on our Monte Carlo simulation. The position of Grus II is marked with the red dot and dashed lines accompanied by error ellipses representing the covariances.
Current usage metrics show cumulative count of Article Views (full-text article views including HTML views, PDF and ePub downloads, according to the available data) and Abstracts Views on Vision4Press platform.
Data correspond to usage on the plateform after 2015. The current usage metrics is available 48-96 hours after online publication and is updated daily on week days.
Initial download of the metrics may take a while.