Free Access
Fig. B.1.
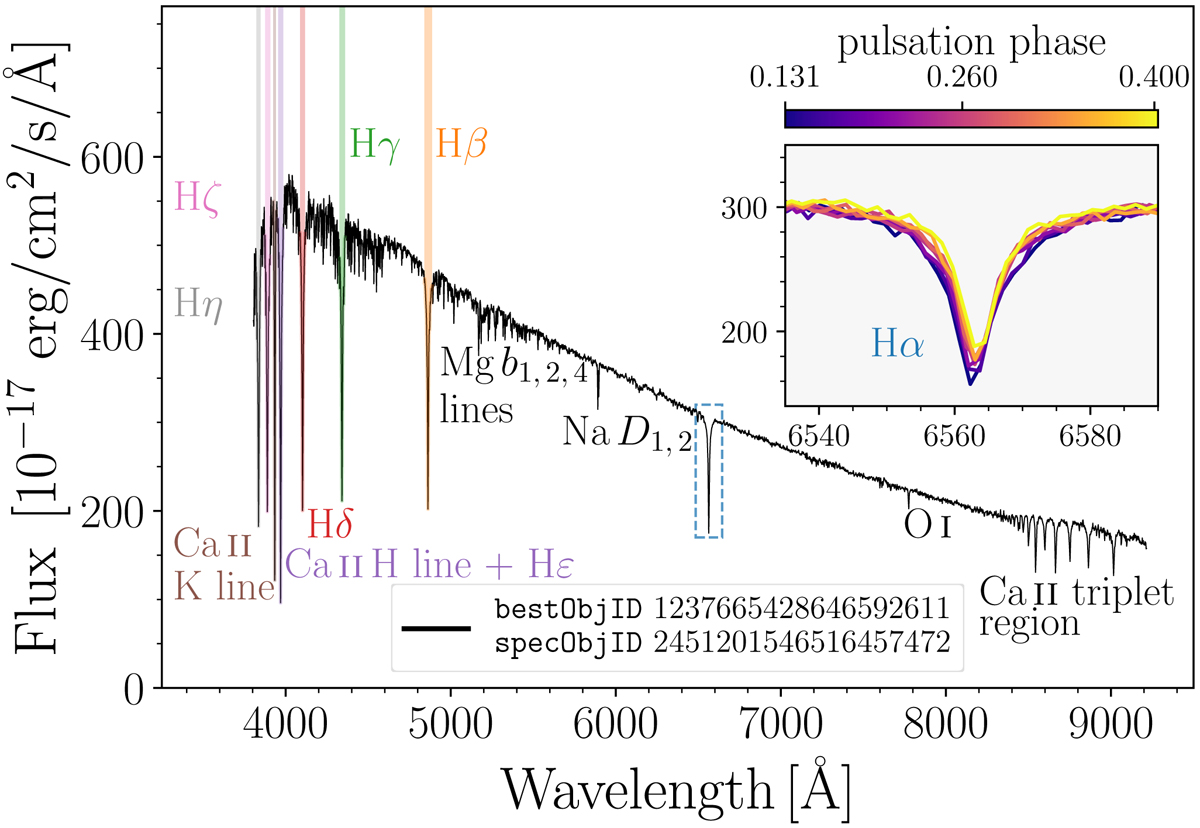
Example of an SDSS co-added spectrum (black line) for an RR Lyrae variable from our sample with the most prominent lines annotated. The individual exposures around the Hα line are depicted in the inset and color-coded based on the pulsation phase.
Current usage metrics show cumulative count of Article Views (full-text article views including HTML views, PDF and ePub downloads, according to the available data) and Abstracts Views on Vision4Press platform.
Data correspond to usage on the plateform after 2015. The current usage metrics is available 48-96 hours after online publication and is updated daily on week days.
Initial download of the metrics may take a while.