Free Access
Fig. 2.
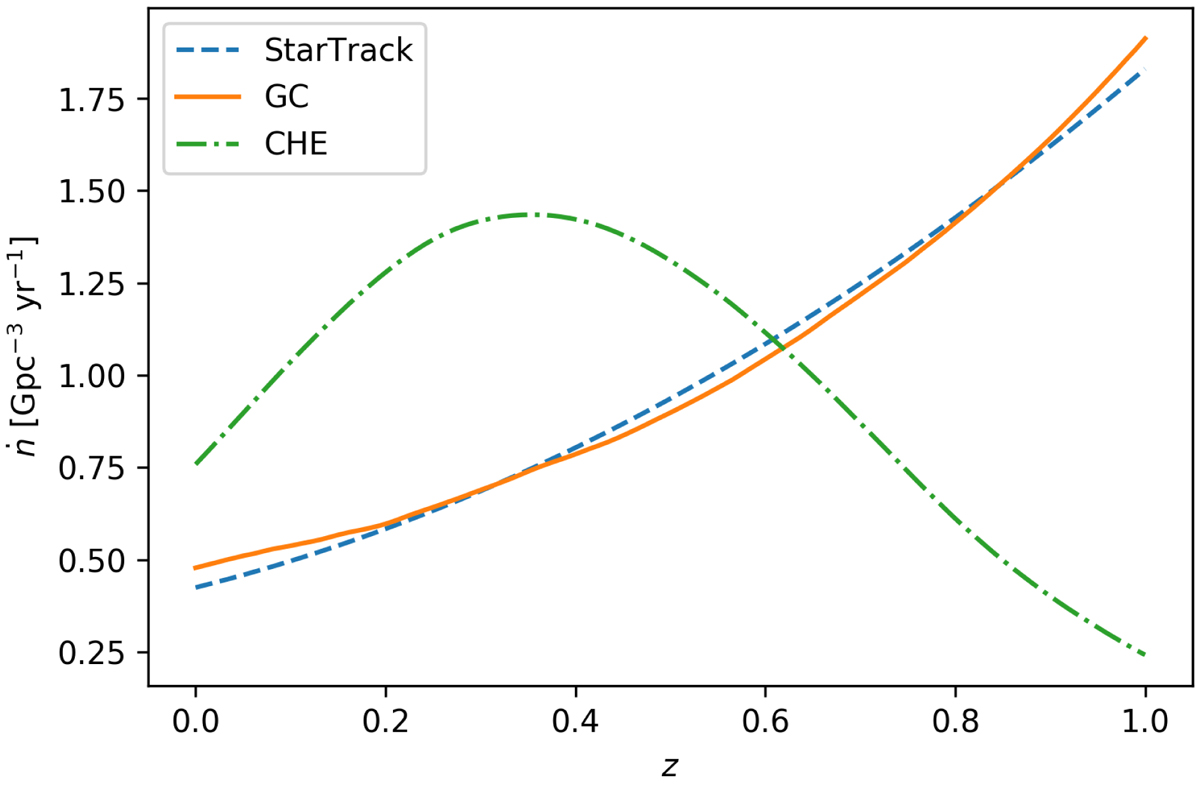
Normalised merger rate distributions of the used models. The dashed, solid, and dot-dashed lines correspond to StarTrack, GC, and CHE models, respectively. StarTrack merger rate density is taken from model M10 from Belczynski et al. (2017).
Current usage metrics show cumulative count of Article Views (full-text article views including HTML views, PDF and ePub downloads, according to the available data) and Abstracts Views on Vision4Press platform.
Data correspond to usage on the plateform after 2015. The current usage metrics is available 48-96 hours after online publication and is updated daily on week days.
Initial download of the metrics may take a while.