Fig. 4.
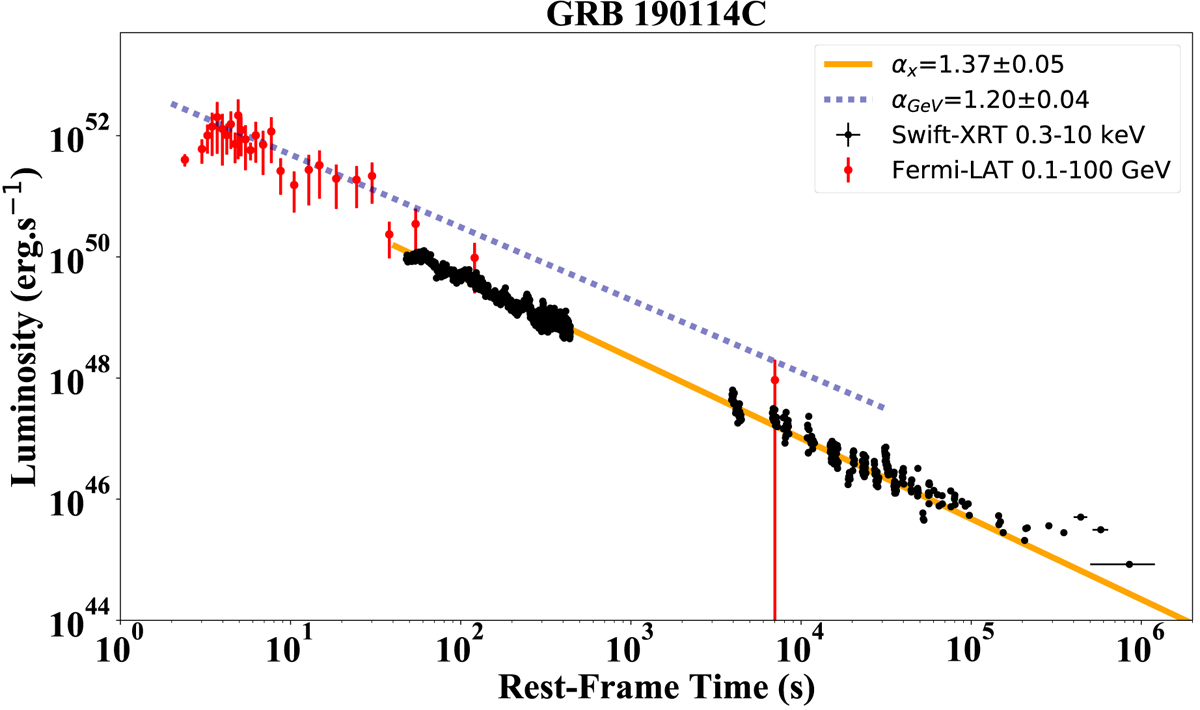
Red data points: rest-frame 0.1−100 GeV luminosity light curve of GRB 190114C during and after UPE phase obtained from Fermi-LAT. Green dashed line: best fit for power-law behavior of the luminosity following the UPE phase with slope of 1.2 ± 0.04 and amplitude of 7.75 ± 0.44 × 1052 erg s−1. Black data points: rest-frame 0.3−10 keV luminosity expressed in the rest frame obtained from Swift-XRT. It follows a power-law behavior with an amplitude of AX = (5.14 ± 2.03) × 1052 erg s−1 and a slope of αX = 1.37 ± 0.05.
Current usage metrics show cumulative count of Article Views (full-text article views including HTML views, PDF and ePub downloads, according to the available data) and Abstracts Views on Vision4Press platform.
Data correspond to usage on the plateform after 2015. The current usage metrics is available 48-96 hours after online publication and is updated daily on week days.
Initial download of the metrics may take a while.